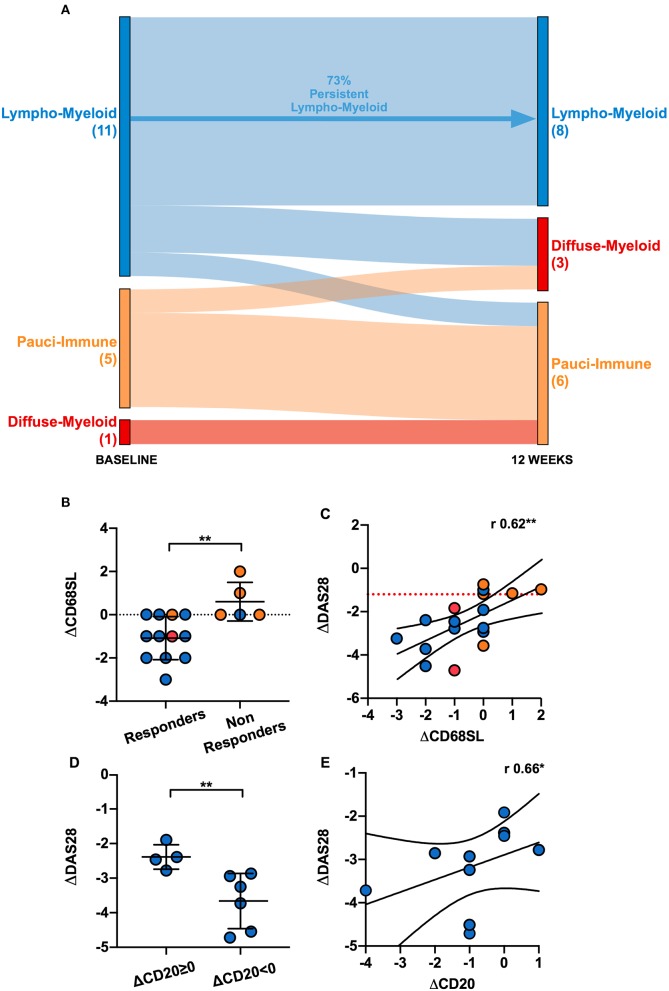
Figure 5.
(A) Sankey diagram representing the shift of pathotypes from pre- to post-treatment of the 17 patients who had gradable tissue both at baseline and 12-weeks. (B) Comparison of the delta (Δ) CD68 sublining (SL) score between responders and non-responders. ΔCD68SL is the difference in the CD68SL semi-quantitative score (0–4) between post- and pre-treatment. Mean and standard deviation shown. **p < 0.01 (Mann-Whitney). (C) Correlation plot showing ΔDAS28[12−weeks−baseline] and ΔCD68SL[12−weeks−baseline]; r Spearman coefficient of correlation, **p < 0.01. (D) Comparison of ΔDAS28 between patients with same/higher (ΔCD20≥0) or reduced CD20+ B-cells score (ΔCD20 < 0) post treatment. **p < 0.01 (Mann-Whitney, mean and standard deviation shown). (E) Correlation plot showing ΔDAS28[12−weeks−baseline] and ΔCD20[12−weeks−baseline]. r Spearman coefficient of correlation, **p < 0.01. Only responder lympho-myeloid patients were analyzed in (D,E) (10 patients). (B–E) Individual dots are color-coded by pathotype (blue, lympho-myeloid; red, diffuse-myeloid; orange, pauci-immune).

