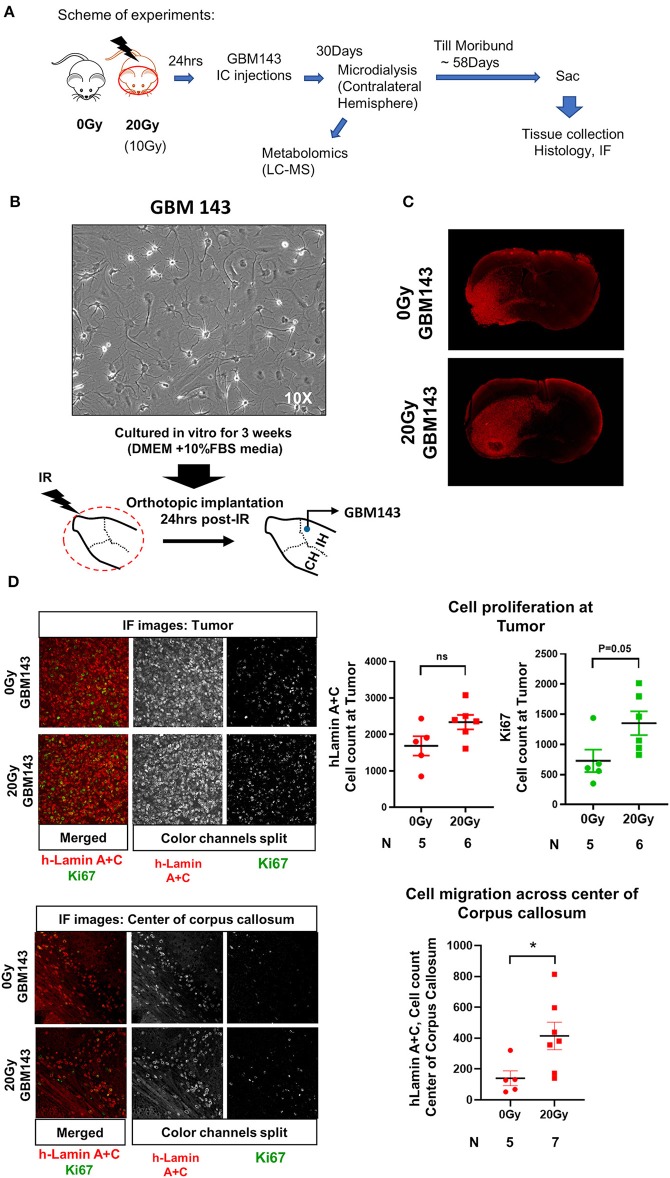
Figure 1.
(A) Scheme of experiments. (B) Representative image (at 10X, transmitted light microscopy) of GBM143 xenograft line cultured for 3 weeks in vitro in media indicated; cells were collected and orthotopically implanted into cranially irradiated mice 24 hrs post-irradiation (IR). (C) Representative Immunofluorescence (IF) images (at 4X, tiling) for hLamin A+C staining from 0 Gy and 20 Gy-IR mice coronal sections to assess tumor growth and invasion. (D) Top: Representative images (at 20X) show IF staining at tumor; and the dot-plot of single cell count for hLamin A+C and Ki67 staining. Bottom: Representative images (at 20X) show IF staining at center of corpus callosum, and dot-plot of single cell count for hLamin A+C. IH, ipsilateral hemisphere; CH, contralateral hemisphere; IR, irradiation. Statistical significance is represented as *p < 0.05.

