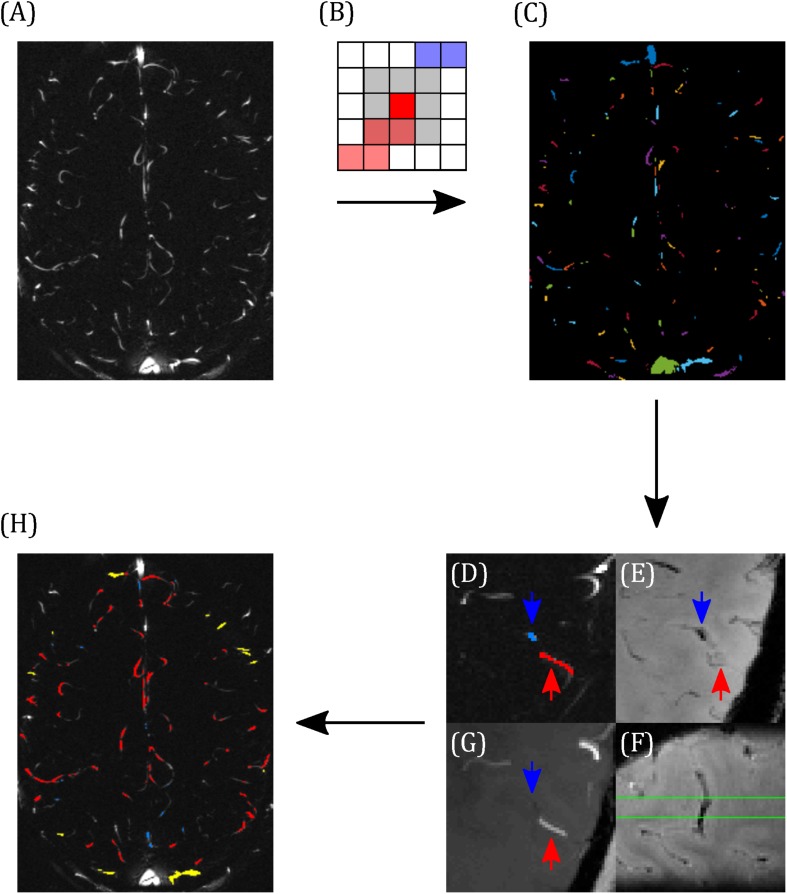
FIGURE 2.
Demonstrating the classification of arteries and veins. (A) Example pcMRI magnitude image. (B) Clusters are formed such that each voxel with a pcMRI magnitude greater than two standard deviations above the mean is included in the same cluster as any of its eight nearest neighbors (gray region) that are also above this threshold. In this example, red and blue voxels are separate clusters. (C) Example of the resulting cluster index map. (D–F) Example classification of a vein (blue) and an artery (red), with blue and red arrows used to identify the same locations across the images. (D) The two clusters of interest (blue and red), overlaid on the pcMRI magnitude image. (E) T2*w minimum intensity projection, showing a hypointensity at the blue cluster indicating a vein. (F) Sagittal slice of the T2*w image, centered on the blue cluster, showing the trajectory of the hypointense vein through the pcMRI slice (bound by the green lines). (G) TOF minimum intensity projection, showing a hyperintensity at the red cluster indicating an artery. (H) Example classification map overlaid on the pcMRI magnitude image. Arteries are shown in red and veins were sub-divided into large cortical veins, observed at the surface of the brain (yellow) and small cortical veins (blue).

