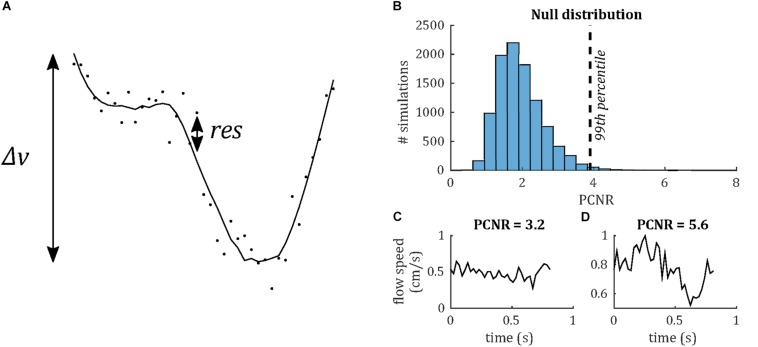
FIGURE 3.
(A) Demonstrating definition of the PCNR parameter (see Eq. 1), with filtered curve (line) overlaid on original waveform (dots). PCNR is the ratio of the range of the curve Δv and the standard deviation of the residual (res). (B) Monte Carlo simulations, calculating PCNR from Gaussian noise waveforms. The 99th percentile corresponding to PCNR > 3.9, while the distribution remains unaffected by changes in noise level or number of timepoints (data not shown). (C) Example waveform which is not classed as pulsatile (PCNR ≤ 3.9) and (D) one that is (PCNR > 3.9).

