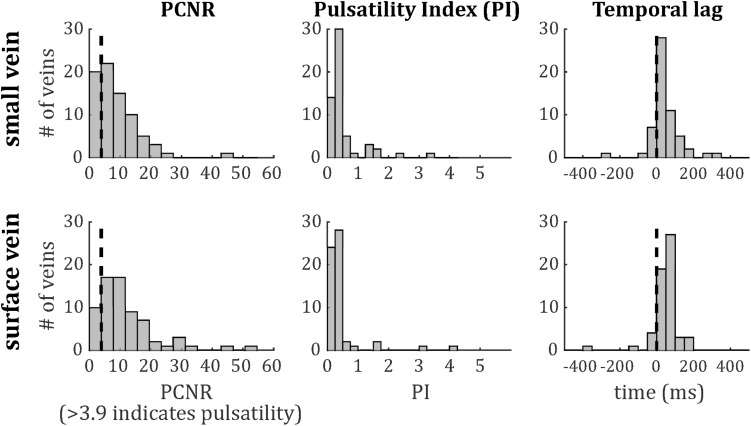
FIGURE 6.
Histograms of (left) PCNR, (middle) PI, and (right) temporal lag for small veins (top) and surface veins (bottom). For PCNR, all veins are included, whereas for PI and temporal lag, only pulsatile veins (PCNR > 3.9) are included. The dashed line in the left panels corresponds to the PCNR = 3.9 threshold. The dashed line in the right panels indicates zero lag compared to the superior sagittal sinus.

