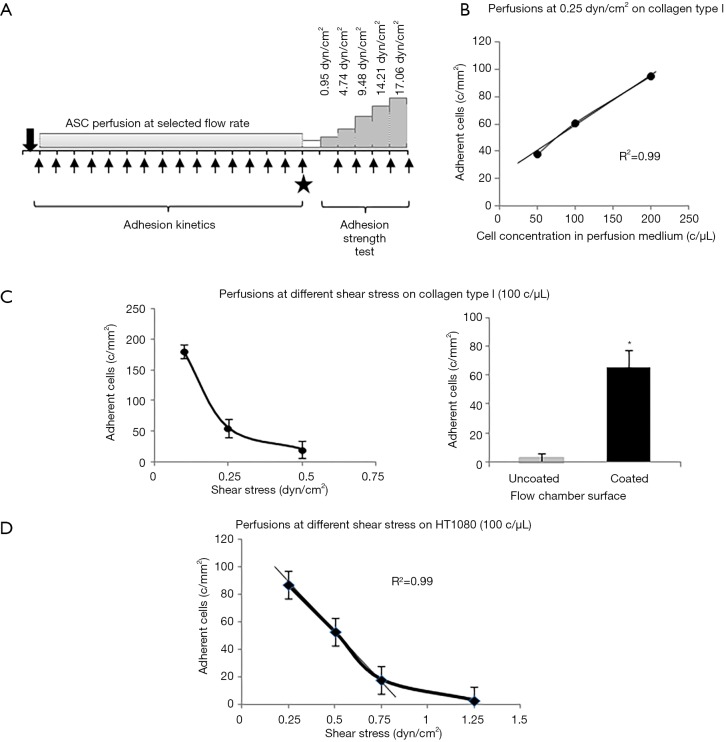
Figure 1.
Schematic representation of adhesion test in dynamic conditions and preliminary assessment of experimental setup. (A) Schematic representation of ASC adhesion capacity test in flow dynamic conditions. The same test frame was applied both on matrix proteins and on primary and cancer cells. Arrows represent image acquisitions and solid star indicates post perfusion collection of pictures of adhering cells in the flow chamber; (B) reference curve describing relationships between concentration of flowing ASC at 0.25 dyn/cm2 and adherent SRGF ASC number; (C) on the left: reference curve describing relationships between flowing ASC shear stress (at the concentration of 100 cells/µL) and the number of adhering SRGF ASC on collagen type I. SRGF ASC perfusions included in (B) and (C) were performed in standard flow medium, i.e., 10% FBS α-MEM medium added with 2% bovine serum albumin. On the right: comparison of adhering SRGF ASC after perfusion at 0.25 dyn/cm2 on collagen type I or on uncoated chamber slide; (D) reference curve describing dependence of adherent SRGF ASC number from flowing ASC shear stress at the concentration of 100 cells/µL. The density of adherent cells on HT1080 after perfusion at 0.1 dyn/cm2 was extremely high (data not shown) suggesting upper saturation limit of the system was reached. SRGF ASC perfusions were performed at different flow rates in standard flow medium, i.e., 10% FBS α-MEM medium added with 2% bovine serum albumin. *, P<0.01 versus “Uncoated”. c/mm2, cells/mm2; c/µL, cells/µL.

