Figure 8.
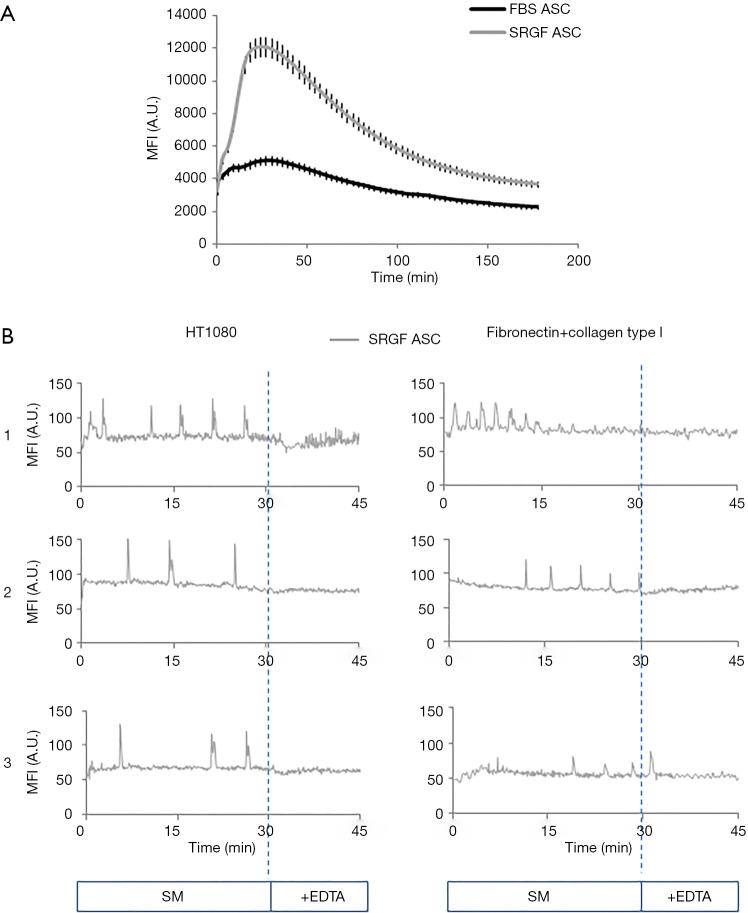
Intracellular concentration changes in FBS and SRGF ASC. (A) Changes over time of intracellular mean fluorescence intensity in FBS and SRGF ASC in static conditions. Cells were labeled with Fluo 4-AM calcium specific dye. Calcium mobilization was triggered by addition to the cell culture medium of the A23187 ionophore; (B) changes over time of intracellular mean fluorescence intensity in SRGF ASC labeled by Fluo 4-AM dye. Three representative graphs [1-3] describing single cell fluorescence changes over time after SRGF ASC adhesion on HT1080 or extracellular matrix were reported. Cell fluorescence analysis was performed in at least 50 single SRGF ASC derived from all 5 patients. In (B), cells were not stimulated by the ionophore. Sequential images were acquired of labeled SRGF ASC immediately after adhesion in parallel flow chambers on HT1080 (0.25 dyn/cm2) or on fibronectin and collagen type I (0.1 dyn/cm2). After 30 minutes perfusion in standard medium i.e., 10% FBS α-MEM medium added with 2% bovine serum albumin, EDTA was added for the remaining 15 minutes. MFI, mean fluorescence intensity; A.U., arbitrary units.

