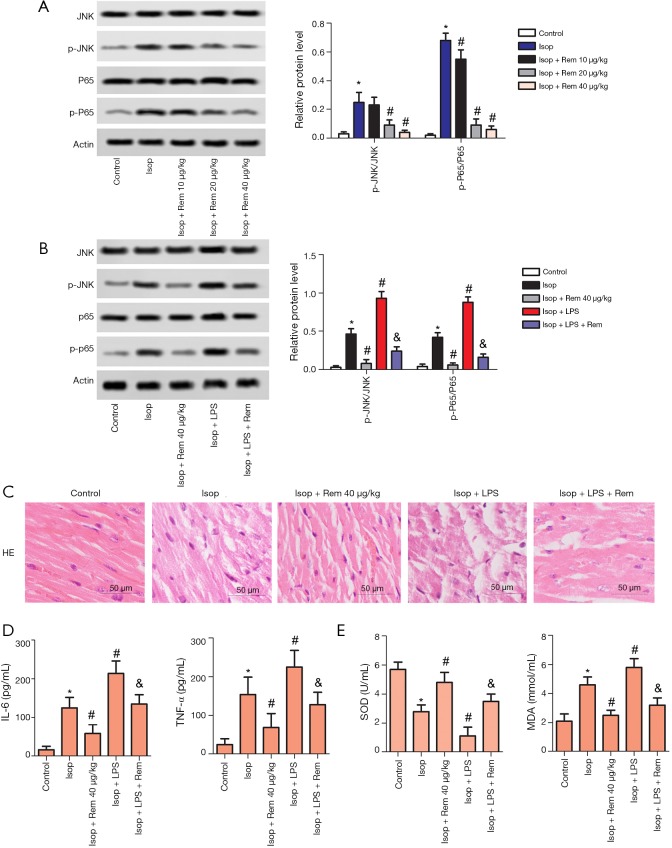
Figure 5.
(A) A representative result for Western blotting analysis of p-JNK and p-p65. Semi-quantitative analysis of the relative level of p-JNK and p-p65 in each group of rats. The rats were randomly divided into 5 groups: the control group, the Isop group, the high-dose group (40 µg/kg remifentanil), the Isop + LPS group, and the Isop + LPS + 40 µg/kg remifentanil group. (B) A representative result for Western blotting analysis of p-JNK and p-p65. Semi-quantitative analysis of the relative level of p-JNK and p-p65 in each group of rats. (C) H&E staining showed that the cardiomyocytes were disordered, the cells were swollen, and some cells were dissolved in the MI rat model. Magnification 200×. (D,E) The protein expression levels of IL-6 and TNF-α were detected by ELISA. MDA concentration in the supernatant with tissue was detected by the thiobarbituric acid chromogenic method. The results were presented as mean ± SD and represent three individual experiments. *, P<0.05 vs. control group, #, P<0.05 vs. Isop group, &, P<0.05 vs. Isop + LPS group. MI, myocardial ischemia.

