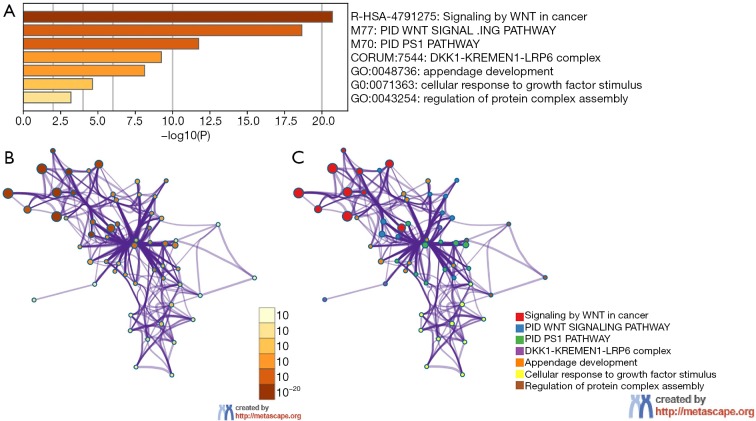
Figure 10.
Heatmap of Gene Ontology analysis including Biological Process (BP), Cellular Component (CC), and Molecular Function (MF) across DKK1 and other 20 most interactive gene lists and an interactive network of the top 11 enrichment terms. (A) Heatmap of Gene Ontology analysis including biological process (BP), cellular component (CC), and molecular function (MF) across DKK1 and the other 20 most interactive gene lists. Orange represents the enrichment terms colored by p values. (B,C) Interactive network of the top 11 enrichment terms colored by cluster ID. Different colors represent various enrichment pathways of DKK1 correlated genes. DKK1, Dickkopf1.

