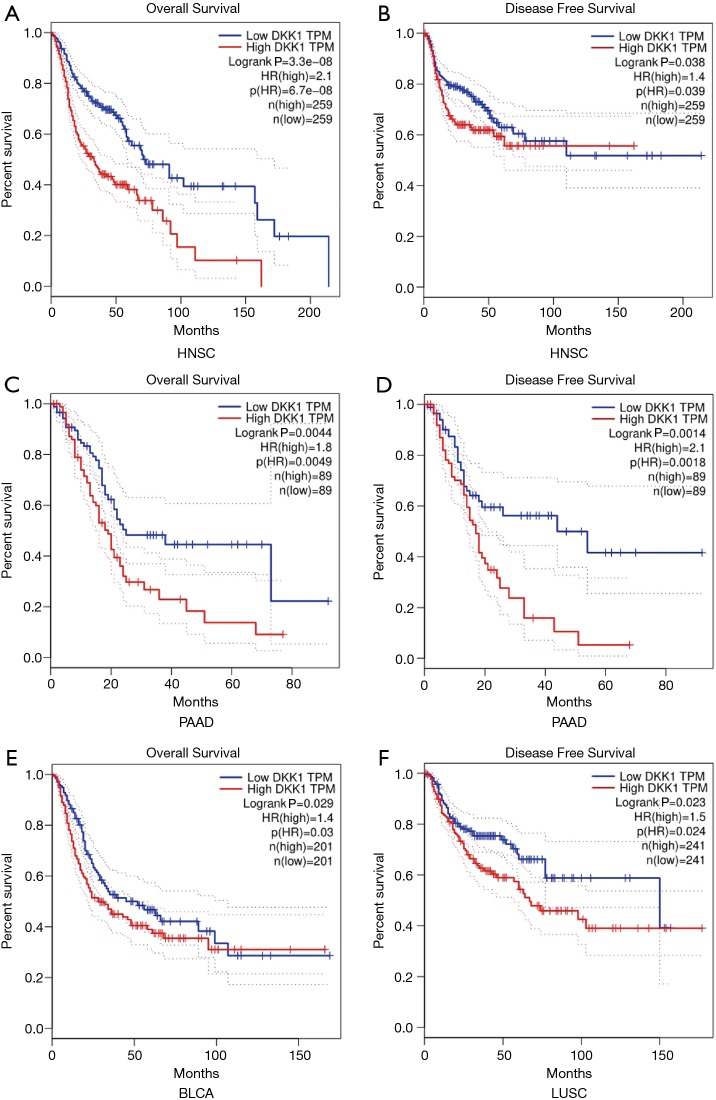
Figure 2.
Survival curves comparing the high and low expression of DKK1 in different types of cancers in the GEPIA database. (A) OS survival curve and (B) PFS survival curve of head and neck squamous cell carcinoma (HNSC) (n=518); high DKK1 expression was correlated with poor prognosis of OS and PFS in HNSC. (C) OS survival curve and (D) PFS survival curve of pancreatic adenocarcinoma (PAAD) (n=178); overexpression DKK1 indicated the adverse outcome of OS and PFS in PAAD. (E) OS survival curve of bladder urothelial carcinoma (BLCA) (n=402); higher expression of DKK1 was related to poor prognosis of OS in BLCA. (F) PFS survival curve of lung squamous cell carcinoma (LUSC); higher expression of DKK1 was related with shortened PFS in LUSC. DKK1, Dickkopf1; GEPIA, Gene Expression Profiling Interactive Analysis; OS, overall survival.

