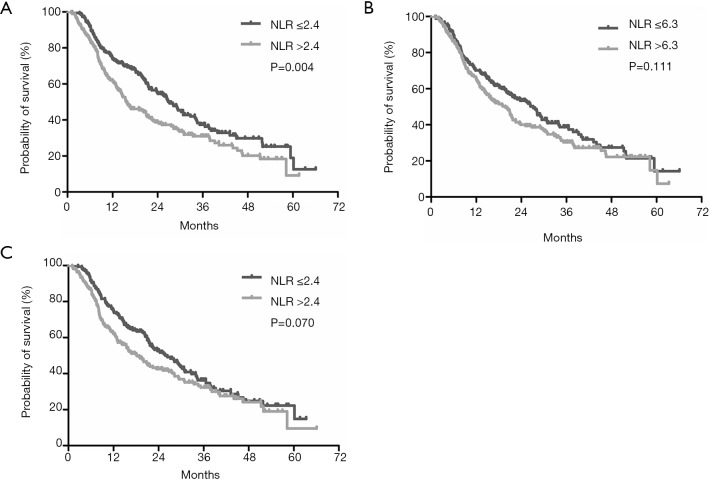
Figure 2.
Kaplan-Meier survival curves among different groups according to patients’ NLR level. (A) Patients with high NLR vs. patients with low NLR at baseline; (B) patients with high NLR vs. patients with low NLR at three days after TACE; (C) patients with high NLR vs. patients with low NLR at one month after TACE. NLR, platelet-to-lymphocyte ratio; TACE, transarterial chemoembolization.

