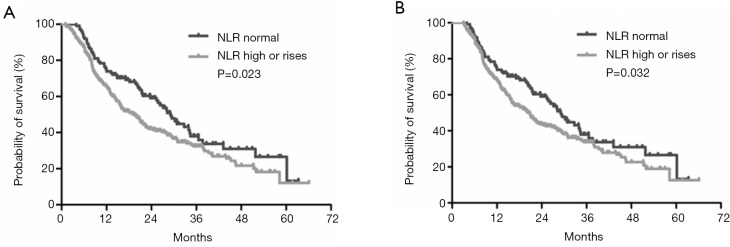
Figure 3.
Kaplan-Meier survival curves among different groups of patients according to patients’ NLR level. (A) Patients with normal NRL vs. patients with high or rises at one month for the whole cohort; (B) patients with normal NRL vs. patients with high or rises at one month for the three-month landmark cohort. NLR, platelet-to-lymphocyte ratio; TACE, transarterial chemoembolization.

