Figure 5.
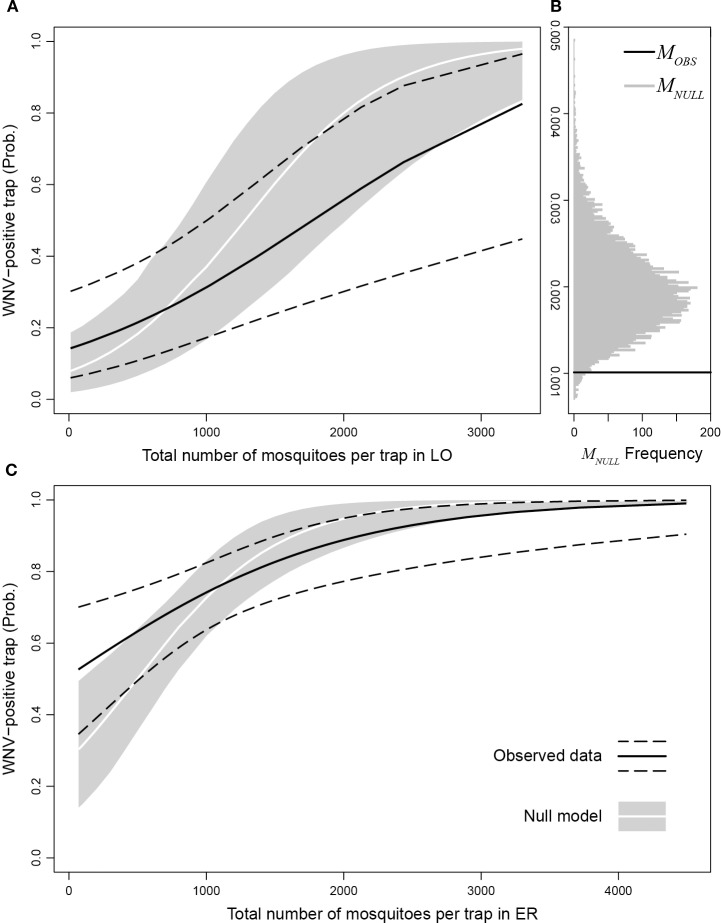
Probability of observing a WNV-positive trap as a function of the number of mosquitoes per trap in Lombardy (A) and Emilia-Romagna (C) estimated through observed data (black solid lines: best fit, dashed lines: 95% confidence interval) compared with the null model (white lines: median, gray areas: 95% interval). (B) distribution of the marginal increase in the probability to observe a WNV-positive trap due to an additionally caught mosquito obtained with the null model (MNULL, gray bars) compared to MOBS (black line).

