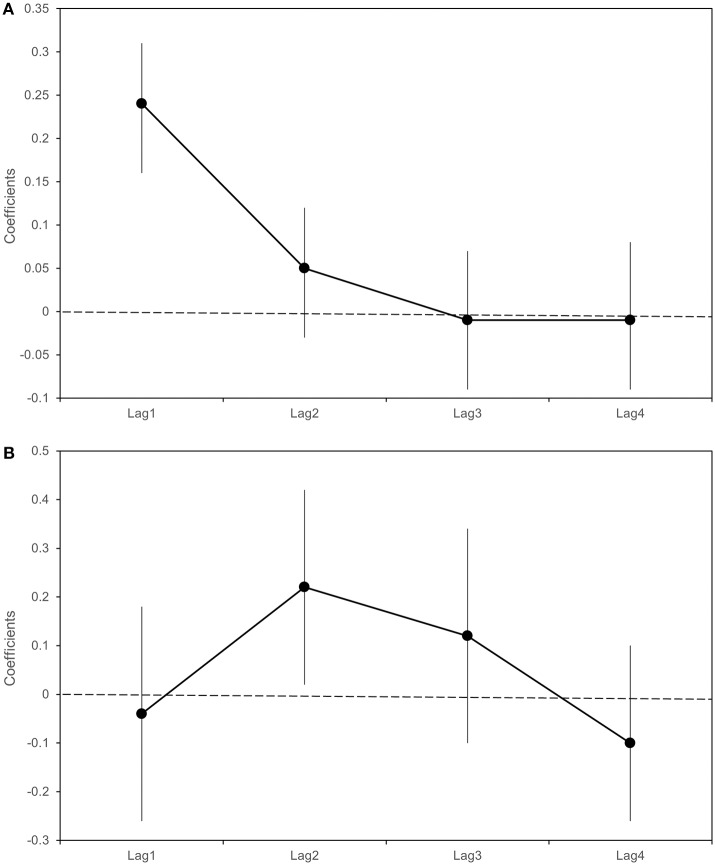
Figure 7.
Beta coefficients (black dots) and 95% Confidence intervals (bars) with respect to a 1°C increase in weekly average maximum temperatures in the previous 4 weeks (lag 1–4). Linear regression estimates for the logarithm of the number of sampled Culex pipiens (A); Poisson regression estimates for Infection Rate (B).

