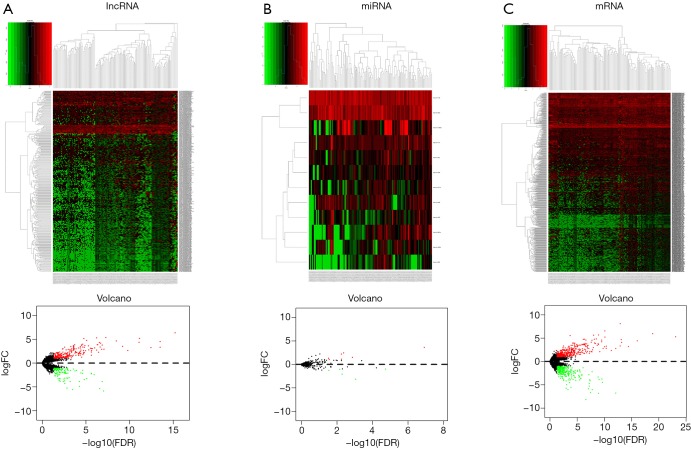
Figure 1.
The heatmap and volcano diagrams of the differentially expressed genes in metastatic renal cell carcinoma (mRCC) of 50 mRCC and 74 ccRCC samples are presented. The ascending normalized expression level is colored from green to red. (A) lncRNA; (B) miRNA; (C) mRNA. ccRCC, clear cell renal cell carcinoma; lncRNA, long-noncoding RNA; FC, fold change; FDR, false discovery rate.

