
Figure 1.
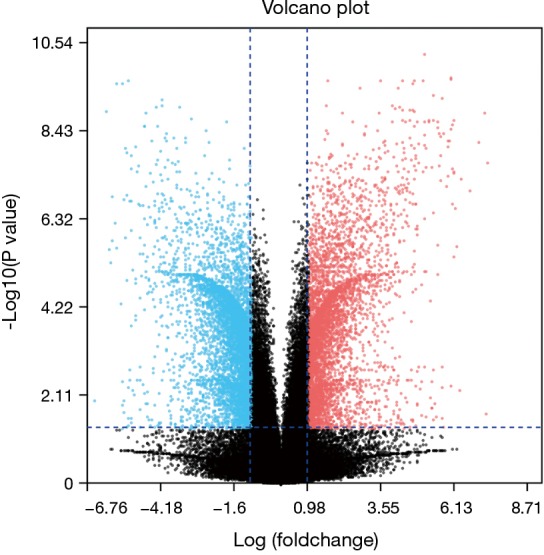
The screening conditions of DEGs in the data set were P<0.05 and logFC interval (≥1.5 or ≤−1.5). Blue is the gene with decreased expression, and red is the gene with increased expression. DEGs, differentially expressed genes.
Official websites use .gov
A
.gov website belongs to an official
government organization in the United States.
Secure .gov websites use HTTPS
A lock (
) or https:// means you've safely
connected to the .gov website. Share sensitive
information only on official, secure websites.
The screening conditions of DEGs in the data set were P<0.05 and logFC interval (≥1.5 or ≤−1.5). Blue is the gene with decreased expression, and red is the gene with increased expression. DEGs, differentially expressed genes.