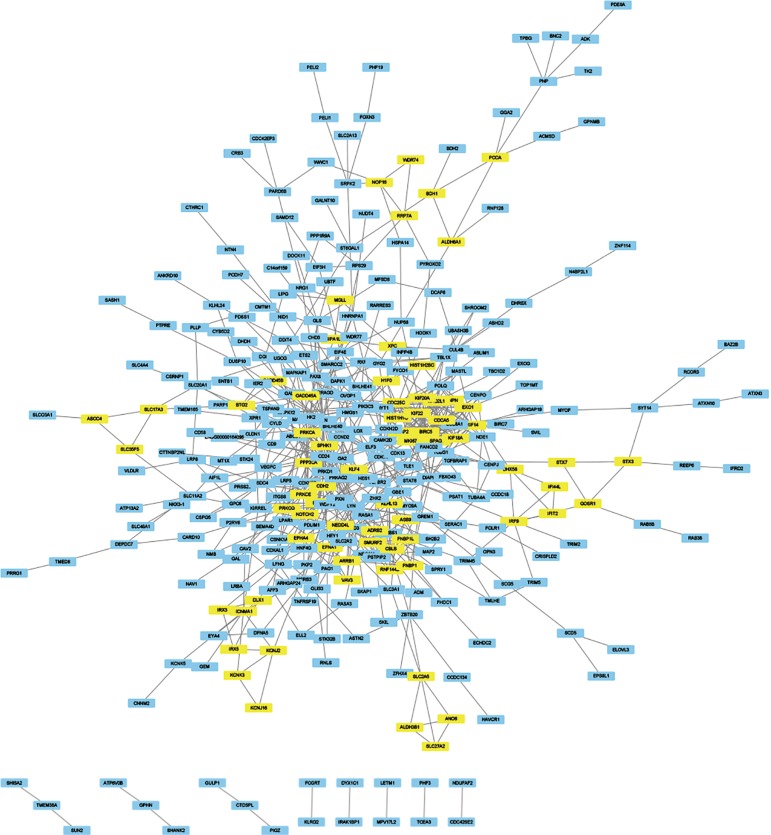
Figure 4.
Through the string website, the 543 DEGs were analyzed according to medium confidence (0.4), and the analysis data were derived. Import the data into Cytoscape for drawing and use the MCODE module to analyze and get several important modules (score ≥3), which are marked with yellow. DEGs, differentially expressed genes.

