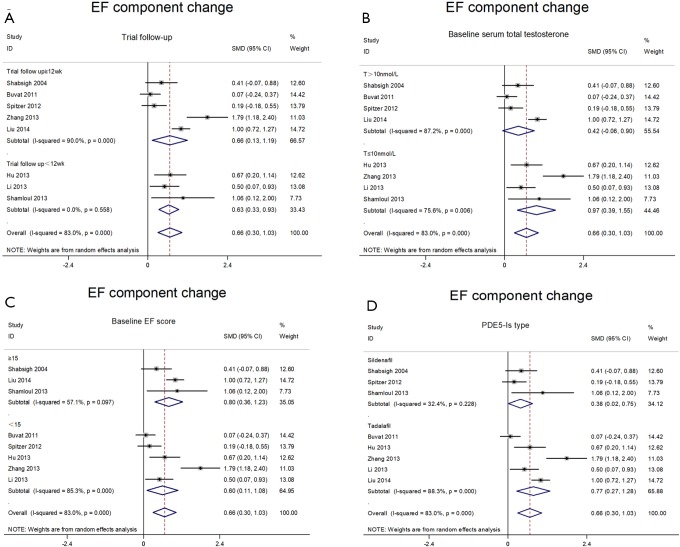
Figure 5.
Forest plot for meta-analysis of the change of erectile function component at trial follow-up ≥12 wk (upper panel) and trial follow-up <12 wk (lower panel) (A), baseline serum total testosterone >10 nmol/L (upper panel) and serum total testosterone ≤10 nmol/L (lower panel) (B), baseline EF score ≥15 (upper panel) and trial EF score <15 (lower panel) (C), sildenafil (upper panel) and tadalafil (lower panel) (D).

