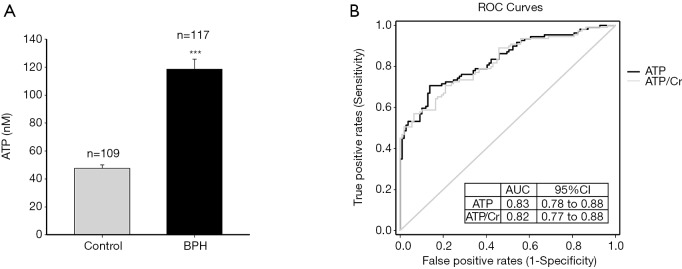
Figure 2.
The diagnostic value of urinary ATP to distinguish between BPH patients and normal people. (A) Comparison of urinary ATP concentration between BPH patients and asymptomatic controls. There was a significant difference between the two groups (***, P<0.001). (B) ROC curves of urinary ATP concentration. ATP (black line) and the results corrected for urinary creatinine levels (ATP/Cr, grey line) were plotted as continuous variables to distinguish between true-positive and false-positive rates among BPH patients and controls. AUC was 0.83 for ATP and 0.82 for ATP/Cr, and both results were significant (P<0.001). There were no differences (P>0.05) between the two variables (ATP vs. ATP/Cr).

