Figure 3.

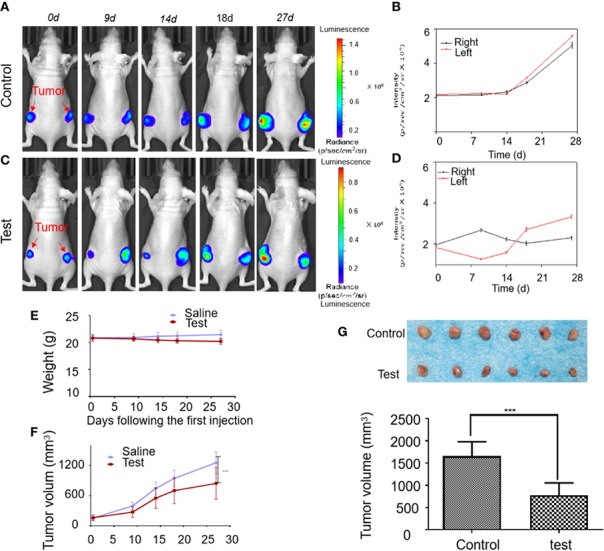
The activity evaluation of Britanin on breast cancer model mouse in vivo. (A) Representative bioluminescence images in an untreated control group of MDA-MB-231 luc inoculated mice tumor model. (B) Quantification of bioluminescence intensity by ROIs that encompass the tumor. Data represent as the means ± S.D. (C) Representative bioluminescence images recorded before and after injection Britanin of 5 mg/kg every 2 d for 27 d by intraperitoneal injection in MDA-MB-231 luc inoculated mice tumor models as the test group. (D) Quantification of the tumor bioluminescence ROIs. Data represent as the means ± S.D. (E) The mouse was weighed before and after Britanin injections, and there was no significant difference with an untreated control group. (F) Tumor volume was calculated before and after Britanin injections. (G) Photograph of excised tumors from the control, test treatment group. The graph represents the average volume of the tumor. ***P < 0.001.
