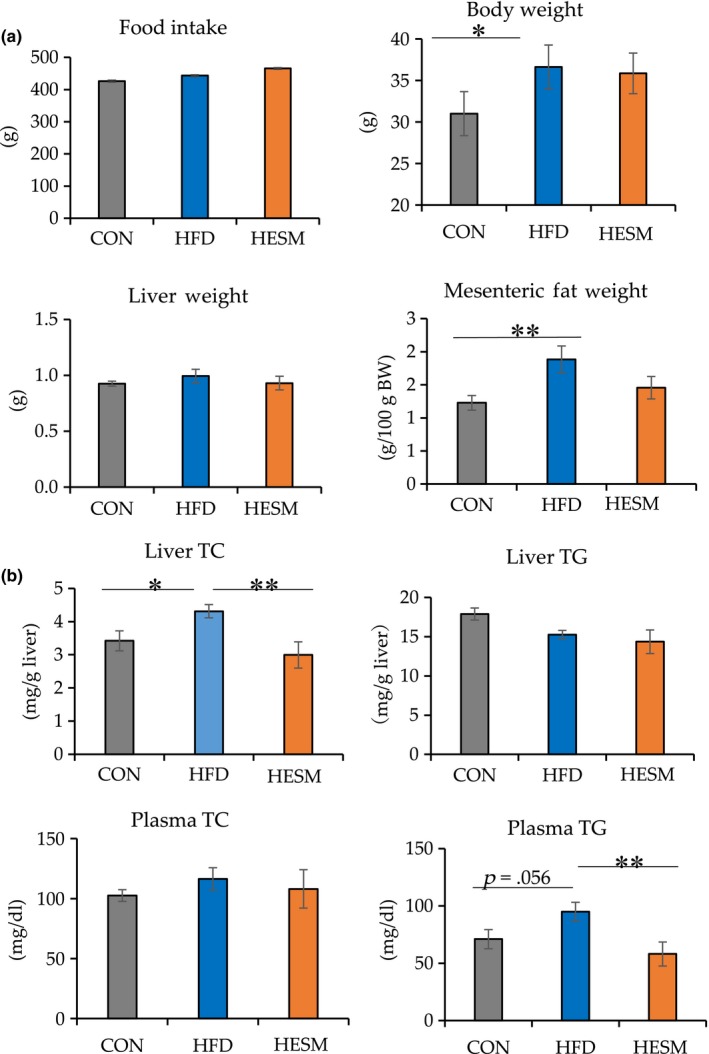
FIGURE 1.

(a) Food intake, body weight, and organ weight and (b) biochemical analysis at 20 weeks of ESM supplementation. Data are presented as means ± SEM (n = 6–7). **Indicates significant at p < .01 and *Indicates significant at p < .05 by one‐way ANOVA and Tukey's test. CON, control mice; HESM, high‐fat diet mice + 8% eggshell membrane powder; HFD, high‐fat diet mice; TC, total cholesterol; TG, triglyceride
