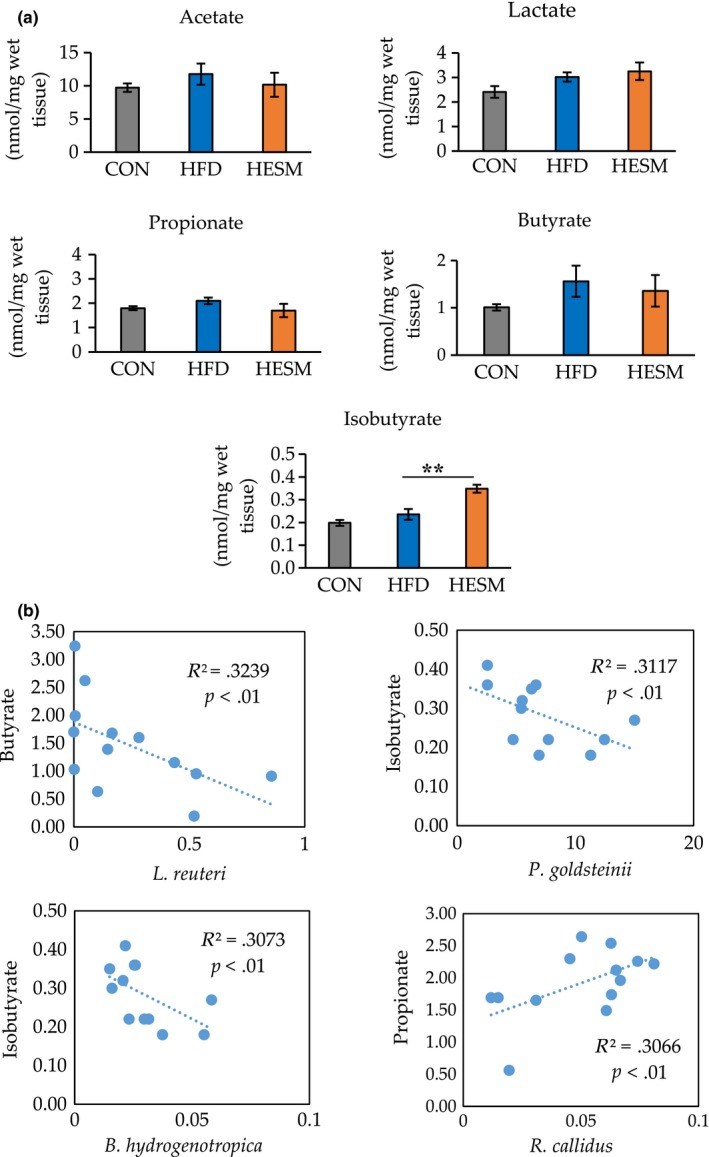
FIGURE 4.

(a) Analysis of cecal SCFA levels in CON, HFD, and HESM mice at 20 weeks of ESM supplementation. (b) Correlations between the relative abundance of bacteria and SCFA levels in HFD and HESM mice. Data are presented as means ± SEM (n = 6–7), and the significance level was set at p < .01 by Tukey's test. CON, control mice; HESM, high‐fat diet mice + 8% eggshell membrane powder; HFD, high‐fat diet mice
