
Figure 4.
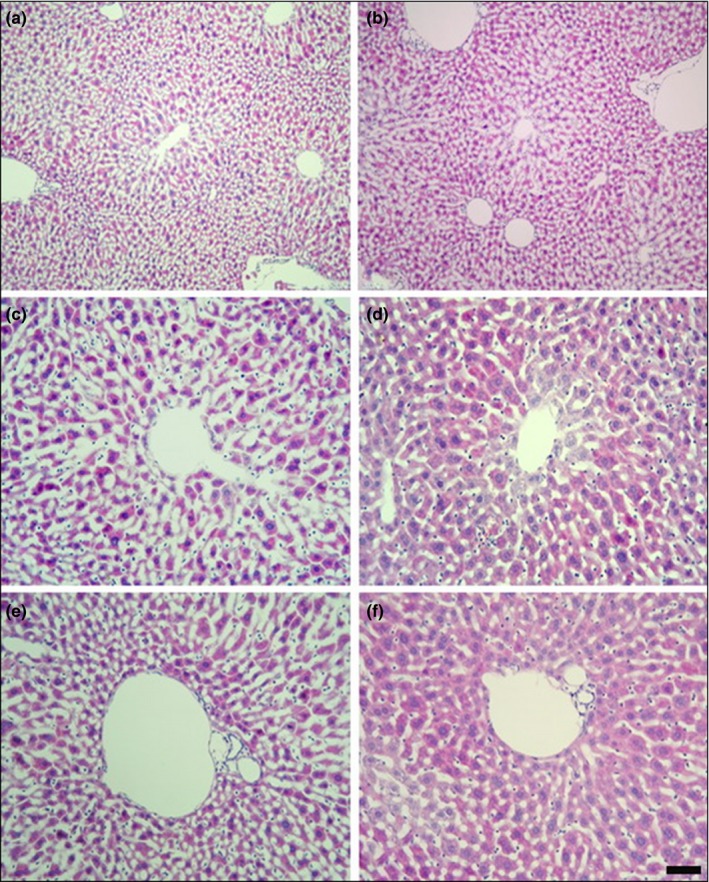
Photomicrography of livers of the mice of the control group (a, c, e) and treated with 1,000 mg/kg groups (b, d, f). Higher magnifications of central vein (c, d) and portal canal (e, f) of liver. Magnification: a, b: ×100, c–f: ×200. Scale bars: a, b: 100 μm, c–f: 50 μm