Figure 4.

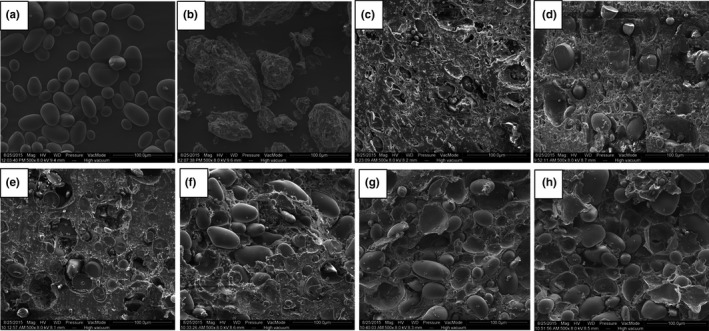
Scanning electron micrographs of native potato starch granules (a), wheat gluten (b), and PS–WG composite dough samples with different starch fractions (c: 0%, d: 20%, e: 30%, f: 40%, g: 50%, and h: 60%)

Scanning electron micrographs of native potato starch granules (a), wheat gluten (b), and PS–WG composite dough samples with different starch fractions (c: 0%, d: 20%, e: 30%, f: 40%, g: 50%, and h: 60%)