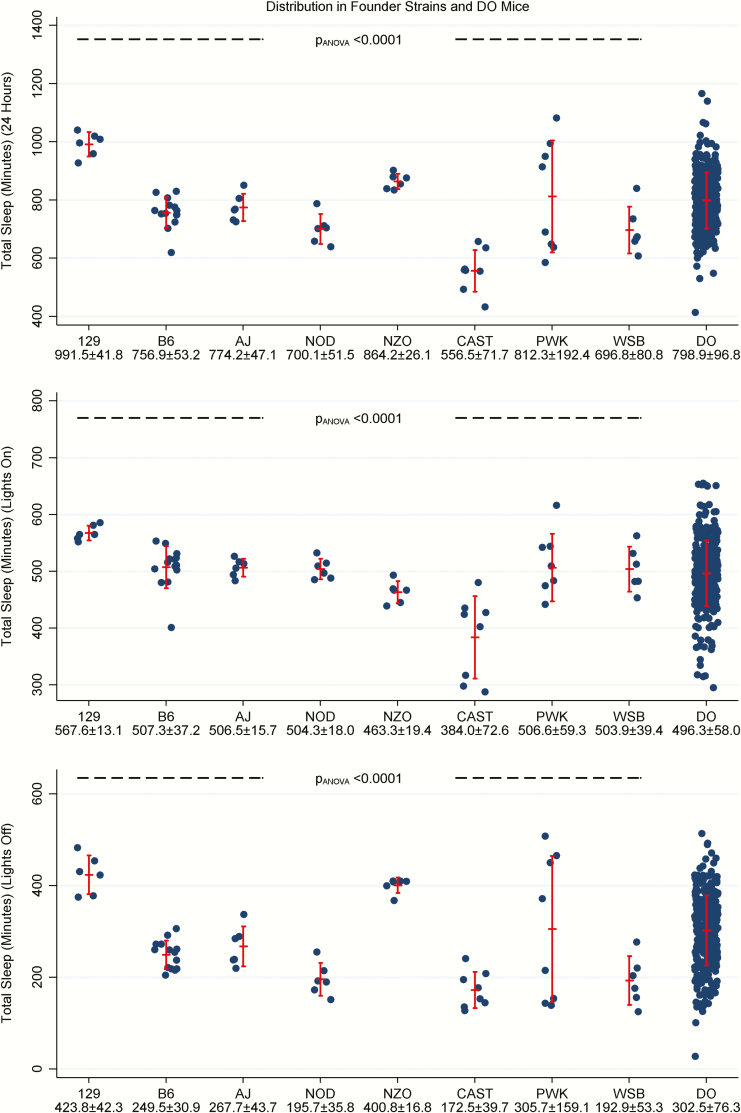
Figure 1.
Total sleep duration in founder strains and DO mice. Plots illustrate the distribution of total sleep duration over 24 h (top panel), and separately during lights-on (middle panel) and lights-off (bottom panel) in founder (N = 60) and DO mice (N = 338). Vertical error bars represent the observed mean ± standard deviation. There were significant differences in total sleep (and wake) duration across the founder strains during all time periods; the 129 strain generally slept the most and the CAST strain the least. Total sleep duration was highly variable in the DO mice, with data spanning or exceeding the full range of values observed in founder strains.

