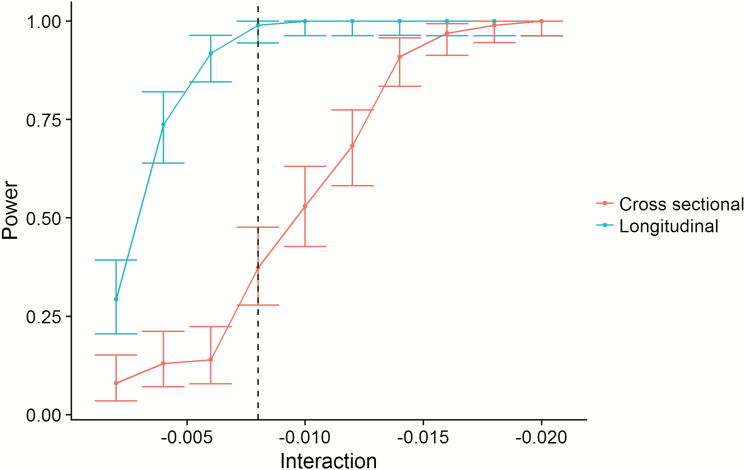
Figure 9.
Statistical power. The figure illustrates the superior power of the longitudinal design. The x-axis represents the size of PSQI × time (longitudinal) or PSQI × age interactions (cross-sectional). The y-axis represents statistical power. The dotted vertical line represents the observed effect size of the sleep efficiency × time interaction. As shown, the power to detect this is close to 1 (100%) with the longitudinal design, and very poor with the cross-sectional design.

