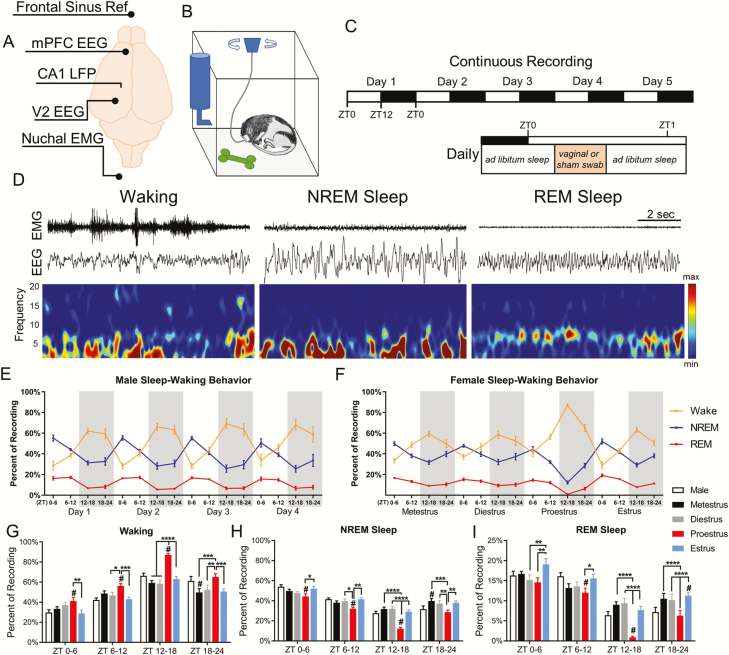
Figure 1.
Sleep–waking behavior changes across the estrous cycle. (A) Configuration of recording electrodes. (B) Schematic of home cage recording setup allowing movement and sleep postures. (C) Experimental timeline of 5 days of continuous recording with 12:12 light–dark cycle (top), and the time within the day where swabbing occurred. (D) Representative 10 s epochs showing EEG and EMG for waking, NREM sleep, and REM sleep. (E) Male sleep–waking behavior across 4 days of recording. Each day is broken into quartiles ZT0–6, ZT6–12, ZT12–18, and ZT18–24. The gray shaded areas represents the dark phase. (F) Female sleep–waking behavior across one complete estrous cycle. (G) The percent time spent in waking, NREM sleep (H), and REM sleep (I). Females were analyzed across phases of the estrous cycle using repeated measures two-way ANOVA: waking F(3, 24) = 27.81, NREM F(3, 24) = 28.36, REM F(3, 24) = 15.58. Tukey post hoc. *p < 0.05, **p < 0.01, ***p < 0.005, ****p < 0.0005. Females were compared with males using two-way ANOVA: waking F(4, 152) = 19.81, NREM F(4, 152) = 19.53, REM F(4, 152) = 12.87. Dunnett post hoc. #p <0.05. Data displayed as mean ± SEM. Males n = 7, females n = 9.

