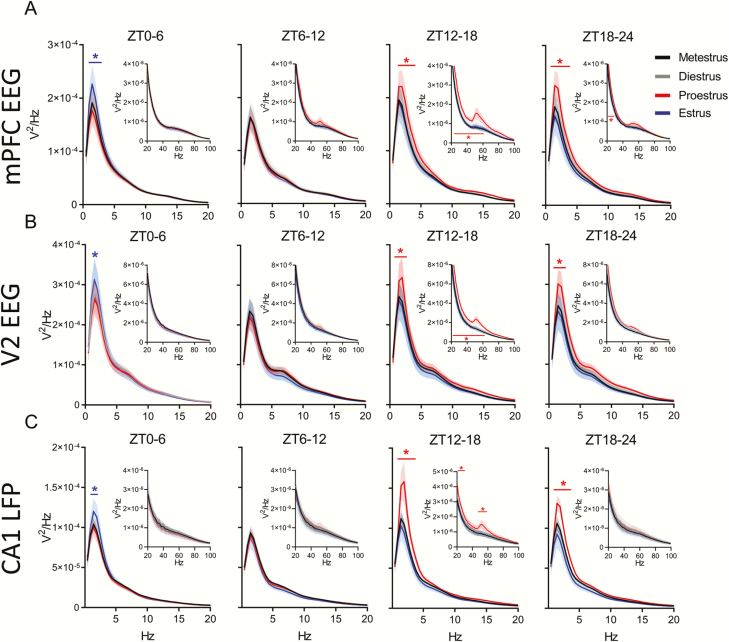
Figure 3.
NREM sleep delta power and slow gamma power changes during proestrus and estrus. (A) Distribution of female rat power spectra during NREM sleep in the medial prefrontal cortex (mPFC) EEG, secondary visual cortex (V2) EEG (B), and CA1 LFP (C). Each 0–20 Hz panel contains a subpanel displaying 20–100 Hz to highlight changes that occur at a higher frequency, but at a lower voltage. The spectral power at each 0.5 Hz frequency bin was analyzed across phases of the estrous cycle using repeated measures two-way ANOVA: parts A and B, F(3, 24), part C F(3, 21). Tukey post hoc. *p < 0.05 The colored line with similar colored asterisk above it represents frequencies where one phase of the estrous cycle is significantly different from all other phases of the estrous cycle. Data displayed as the darker line represents the mean and the lighter shaded region of analog color represents the SEM for that group. For both mPFC EEG and V2 EEG, n = 9 females. For CA1 LFP, n = 8, as one animal had a broken depth electrode.

