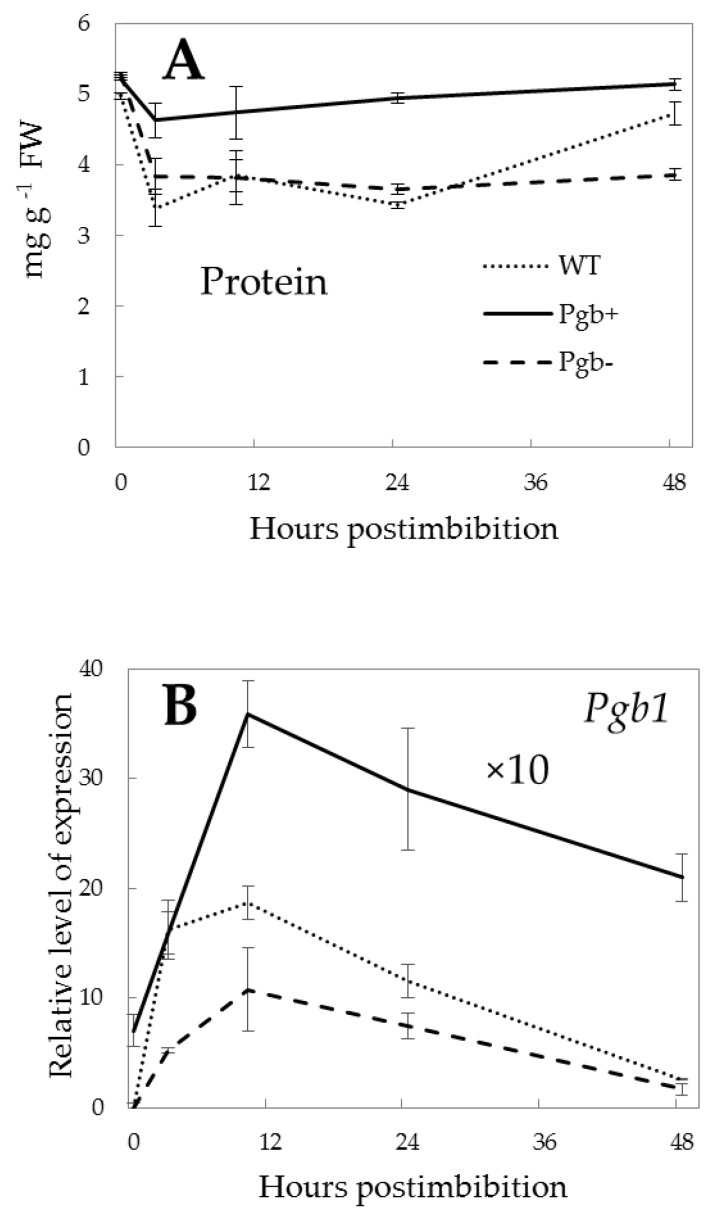
Figure 2.
Changes in total protein content (A) and Pgb1 expression (B) in the embryo of barley during germination. Solid line: Pgb+, overexpressed phytoglobin; dashed line: Pgb-, knockdown phytoglobin; dotted line: WT, wild type. The values for relative level of expression of Pgb+ should be multiplied by 10 times. The vertical bars represent the values of standard deviations.

