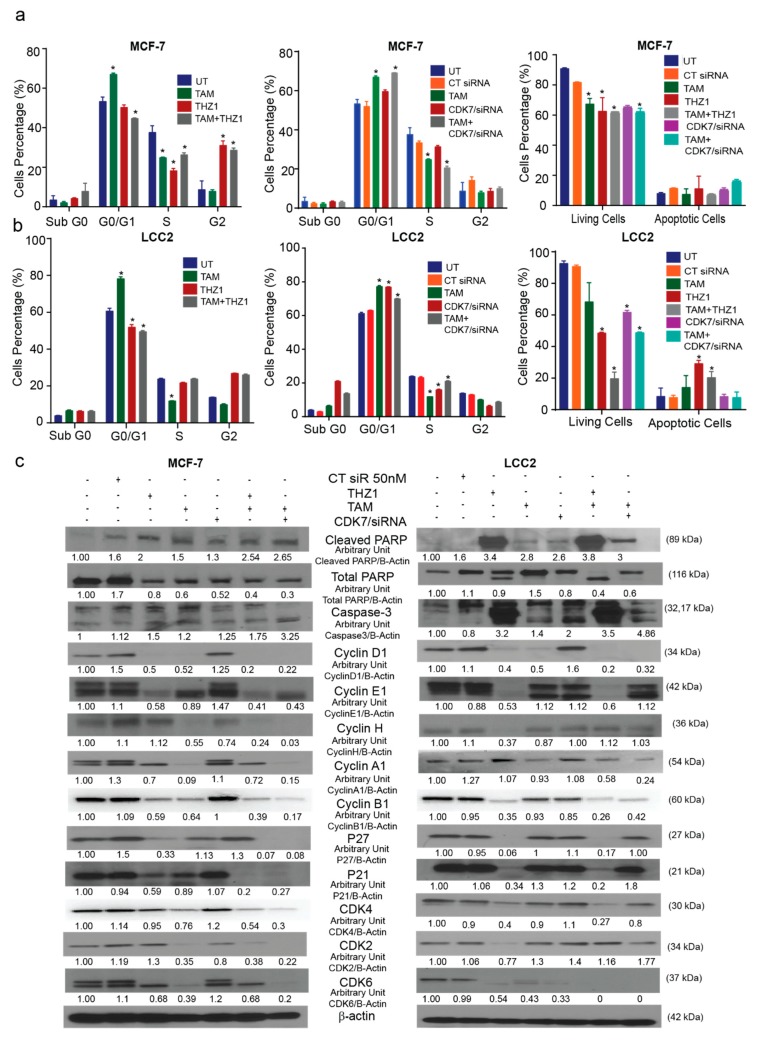
Figure 4.
Effects of CDK7 inhibition combined with tamoxifen on the cell cycle and apoptosis. (a) Histograms showing the results of the flow cytometry analysis of the cell cycle and apoptosis assays of MCF-7 cells. (Left) Cell cycle analysis of MCF-7 cells treated with the indicated concentrations of tamoxifen, THZ1, and their combination. (Center) Cell cycle analysis of MCF-7 cells treated with the indicated concentrations of tamoxifen, CT siR, CDK7 siR, and the combination of tamoxifen plus CDK7 siR. (Right) Percentage of living and apoptotic MCF-7 cells treated with the indicated treatments. (b) Histograms showing results of flow cytometry analysis of the cell cycle and apoptosis assays of LCC2 cells. (Left) Cell cycle analysis of LCC2 cells treated with the indicated concentrations of tamoxifen, THZ1, and their combination. (Center) Cell cycle analysis of LCC2 cells treated with the indicated concentrations of tamoxifen CT siR, CDK7 siR, and the combination of tamoxifen plus CDK7 siR. (Right) Percentage of living and apoptotic LCC2 cells treated with the indicated treatments. (c) Western blots of cell cycle and apoptosis markers in cells exposed to tamoxifen, THZ1, and CDK7 siR, individually and in combination. For Western quantification imageJ software was used to measure the intensity and normalize each value to its corresponding β-actin. Results in the graphs are expressed as mean ± SD of two independent experiments performed in triplicate. Statistical significance was determined by one-way ANOVA using the Tukey multiple comparison test. * p < 0.05. UT, untreated.

