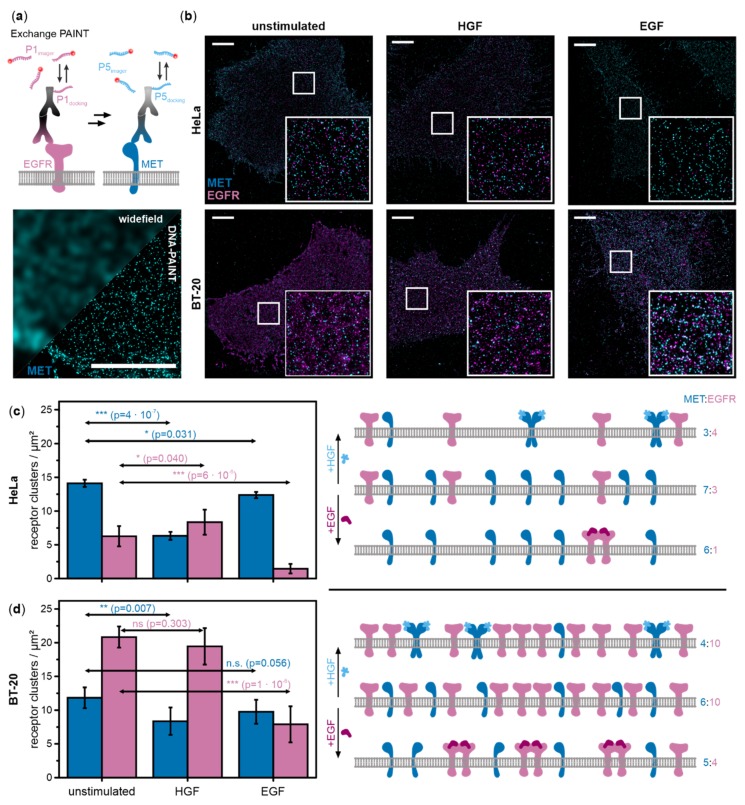
Figure 1.
MET and epidermal growth factor receptor (EGFR) densities in the cell membrane of HeLa and BT-20 cells. (a) Concept of super-resolution microscopy by Exchange-PAINT of MET and EGFR (top). A super-resolved image is obtained from transient binding events of short, fluorescently labeled DNA oligonucleotides to DNA-labeled antibodies. The image (bottom) shows MET visualized by widefield microscopy versus DNA-PAINT (scale bar 5 µm). (b) Exchange-PAINT images of MET (cyan) and EGFR (magenta) immunostained with secondary antibodies carrying P5 and P1 DNA docking strands and labeled with complementary DNA imager strands labeled with ATTO 655. Total internal reflection fluorescence (TIRF) images of the plasma membrane of HeLa and BT-20 cells were recorded either in the unstimulated state, after hepatocycte growth factor (HGF) stimulation, or after activation with epidermal growth factor (EGF) (scale bar 5 µm, insets 5 µm × 5 µm). Receptor cluster densities of MET (cyan) and EGFR (magenta) in (c) HeLa and (d) BT-20 cells were determined from DNA-PAINT images (n = 6–7 cells/condition from at least three independent experiments) and plotted in the histogram (left). (Note that receptor clusters refer to both monomers and dimers.) Error bars represent standard deviations. Results of two-sample t-tests for comparison of activated samples with the respective unstimulated sample are depicted as arrows (p > 0.05 no significant difference between populations (n.s.), p < 0.05 significant difference (*), p < 0.01 very significant difference (**), p < 0.001 highly significant difference (***)). The quantitative data was used to generate density and activation schemes of MET and EGFR in HeLa and BT-20 (numbers at the right indicate relative receptor ratios at the cell membrane determined from DNA-PAINT images).

