Figure 2.
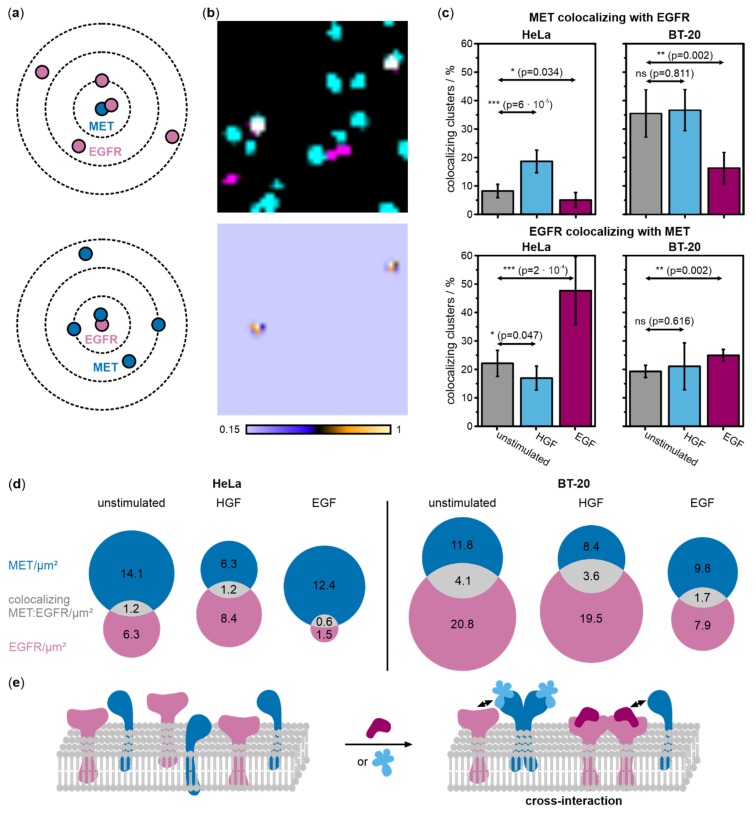
Coordinate-based colocalization analysis of DNA-PAINT data of MET and EGFR reveals increased receptor colocalization upon ligand stimulation in HeLa and BT-20 cells. (a) Representation of the principle of coordinate-based colocalization (CBC) of MET (cyan) and EGFR (magenta). For each receptor localization, the numbers and distances of surrounding receptors of the other species were determined (search radius r = 30 nm) and a distribution function calculated that reports on colocalization (−1 < CBC > 1). (b) Dual-color super-resolution images of MET and EGFR (top) were transformed into colocalization images (bottom) (0.15 < CBC < 1) (image sizes are 1 µm × 1 µm). (c) The relative amount of MET and EGFR colocalizing in single clusters in HeLa and BT-20 cells with respect to the total amount of the respective receptor in unstimulated (grey), HGF-activated (light blue), and EGF-stimulated (purple) cells. Values were averaged over 5 to 7 cells from at least three independent experiments. Error bars represent standard deviations. Results of two-sample t-tests for comparison of activated samples with the respective unstimulated sample are depicted as arrows (p > 0.05 no significant difference between populations (n.s.), p < 0.05 significant difference (*), p < 0.01 very significant difference (**), p < 0.001 highly significant difference (***)). (d) Receptor cluster densities (per µm2) on the cell membrane of MET (cyan) and EGFR (magenta) together with colocalizing MET:EGFR clusters (gray) shown as Venn diagrams for HeLa and BT20 cells. Densities of co-localizing receptor clusters were calculated from an average of the number of co-localizing clusters in the MET and EGFR channel (see Materials and Methods). (e) A model of MET and EGFR cross-interaction upon stimulation with either EGF or HGF.

