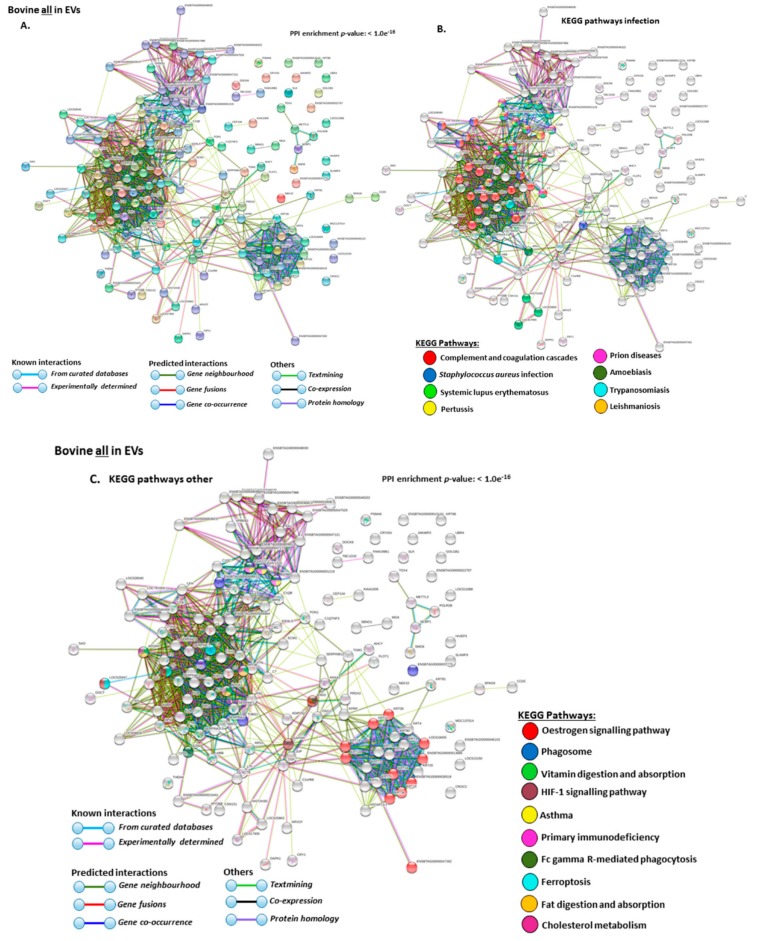
Figure 6.
Protein–protein interaction networks of all deiminated proteins identified in serum-EVs of Bos taurus. Protein–protein interactions were reconstructed based on both known and predicted interactions by STRING analysis. (A) Query proteins are indicated by the coloured nodes and represent the first shell of interactors. (B) KEGG pathways reported in STRING and relating to infection are highlighted (see colour code included in the figure). (C) KEGG pathways relating to the identified proteins and reported in STRING are highlighted for other pathways (see colour code included in the figure). The coloured lines highlight which protein interactions are identified through known interactions (this refers to curated databases, experimentally determined), through predicted interactions (this refers to gene neighborhood, gene fusion, gene co-occurrence) or through co-expression, text mining or protein homology (the colour key for connective lines is included in the figure).

