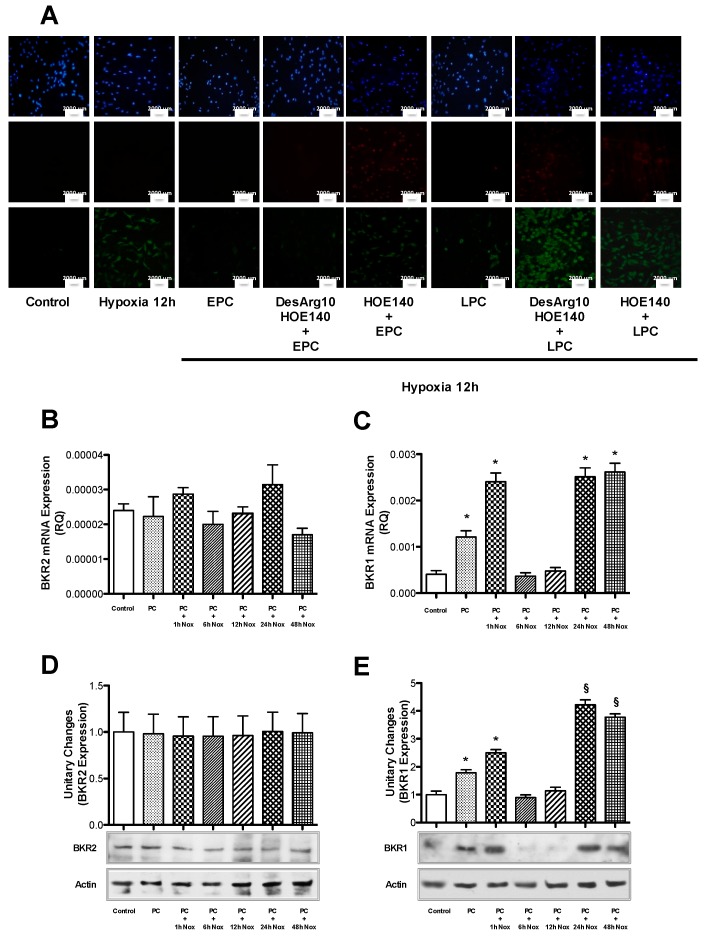
Figure 3.
(A) Cells were subjected to prolonged hypoxia (12 h) after early and late preconditioning (EPC and LPC), in the absence and presence of selective bradykinin receptor 1 (BKR1) and 2 (BKR2) inhibitors (desArg10-HOE-140 and HOE-140, respectively). Cells were stained with Annexin-V (green), Propidium Iodide (PI, red) and DAPI (blue). The rates of apoptosis and necrosis were calculated by dividing the number of Annexin-V-positive/PI-negative cells and Annexin-V-positive/PI-positive cells, respectively, by the total number of nuclei detected with DAPI staining. The percentage of apoptotic and necrotic cell death was calculated from four independent experiments. Quantification of apoptosis and necrosis is reported in Table S2 of Supplementary Material. The size of the scale bar is 2000 µm. (B) The transcription of the mRNA coding for (B) BKR2 and (C) BKR1 was assessed at different times following PC (Nox: normoxia). The bar graph represents the mean ± SEM, expressed as the RQ value, from four independent experiments. The protein expression of BKR2 (D) and BKR1 (E) was assessed at different times following PC. The bar graph shows the mean ± SEM, expressed as the fold increase in BKR2 and BKR1 expression over that in control cells, of three independent experiments. Nox: normoxia. * p < 0.001 vs. control; § p < 0.001 vs. control and PC + 1 h Nox, by one-way ANOVA with a post hoc test of HSD.

