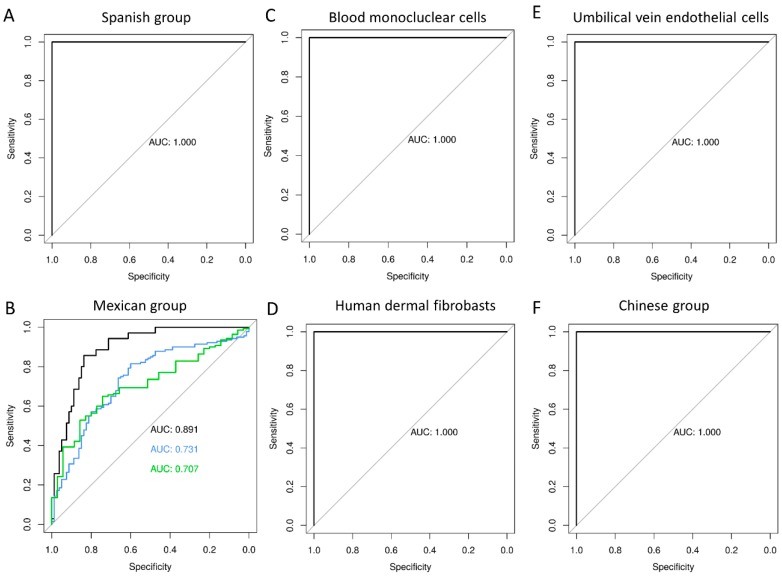
Figure 2.
Evaluation of VS test performance. AUC (Area Under the Curve) values are provided in Table 1. ROC curves for VS: (A) Discovery group (Spanish group); (B) Test group GSE69529; (C) External validation group GSE98859; (D) External validation group GSE121385; (E) External validation group GSE94551; and (F) External validation group PRJNA230906. For all figures, the horizontal lines in boxes indicate median of the groups; the lower and upper sides of boxes interquartile ranges and the whiskers < 1 times the interquartile range. On the x-axis is the sample status and on the y-axis the VS calculated as log2 of the sum of counts of our 2-transcript diagnosis model.

