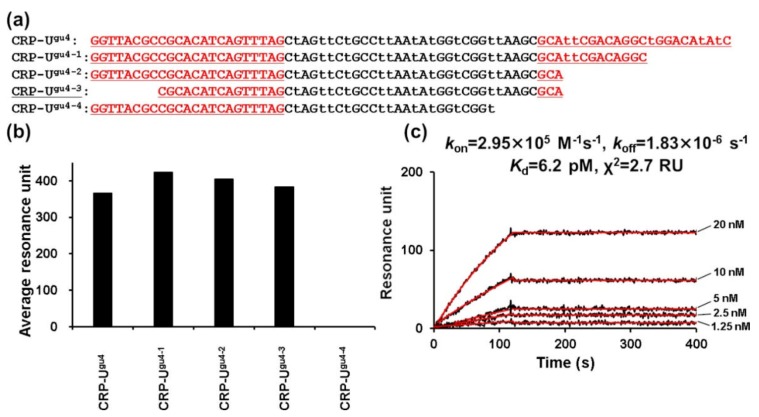
Figure 3.
CRP–Ugu4 truncated aptamer preparation. (a) Sequences of the CRP–Ugu4 truncated aptamers. Sequences are aligned in the 5′ to 3′ direction. Underlined regions derive from the primer or primer-binding regions. The letter “t” indicates Ugu. (b) SPR response units of the interaction between the CRP and the CRP–Ugu4 truncated aptamers. Measurements were performed with multicycle kinetics, and CRP (400 nM) was injected over the respective aptamer-immobilizing sensor chips for 120 s at a flow rate of 50 μL/min. SPR response units between 115–125 s, in the plateau region of the sensorgram curves, were averaged. (c) Representative SPR sensorgrams showing the interaction between the CRP and the aptamer CRP–Ugu4−3. Various concentrations of CRP (1.25–20.00 nM) were injected over the respective CRP-Ugu4−3-immobilizing sensor chip for 120 s at a flow rate of 50 μL/min. The black line represents the measured curve, and the red line represents the fitting curve. The average of the squared differences between the measured data points and the corresponding fitted values are represented as χ2.

