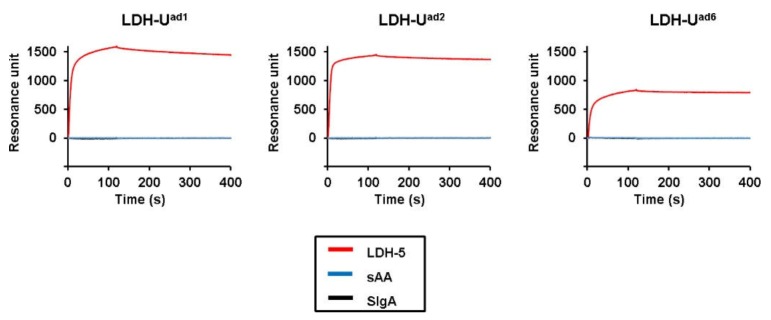
Figure A3.
SPR response curve of the interaction between either LDH-5 or the salivary proteins SIgA and sAA and the candidate aptamers LDH–Uad1, Uad2, and Uad6. LDH-5, SIgA, or sAA (400 nM each) were injected over the respective aptamer-immobilizing sensor chips for 120 s at a flow rate of 50 μL/min. The red line represents the LDH-5 measured curve, while the blue and black lines represent the sAA and SIgA recorded curves, respectively.

