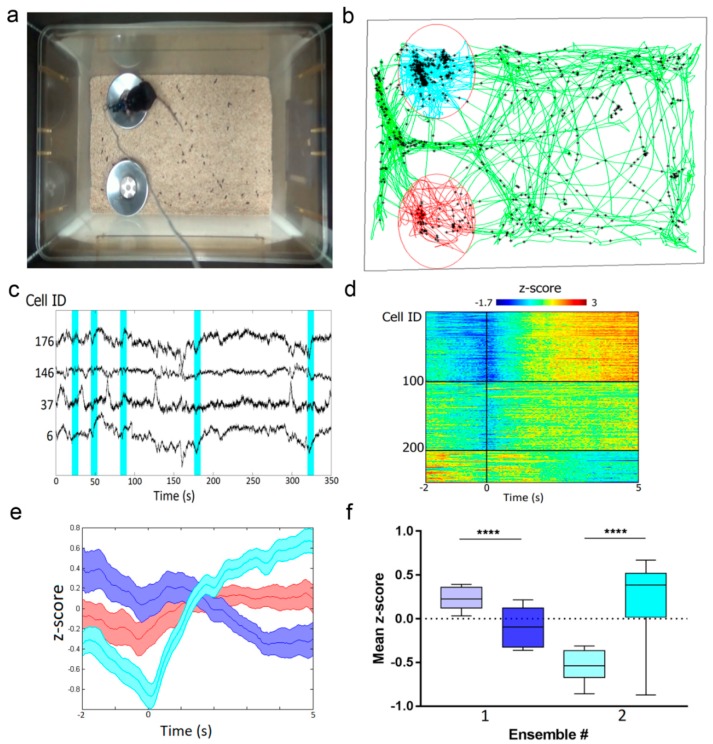
Figure 7.
In vivo neuronal Ca2+ activity in mouse hippocampus during food intake visualized using FGCaMP7 and an nVista HD miniscope. (a) Photo of the mouse with an nVista HD miniscope mounted on its head during food intake. (b) Mouse trajectory for 1-h imaging session (green) with spikes from all detected neurons (black stars), red and cyan curves—trajectory in the area of cups. Context size: 40 cm by 30 cm. (c) Example normalized ΔF/F0 Ca2+ signals for four individual neurons recorded during the session. Cyan areas show time windows 2 s before entering the cup area and 5 s after. (d) Mean responses of clustered groups of neurons upon cup area-entry transitions (n = 253 neurons from two mice; number of entries, 17 and 24). Zero marks cup area-entry time points. Cells were ordered according to k-means clustering. (e) Average cup area-entry responses of activated (cyan), inhibited (blue) and indifferent (red) ensembles. Lines indicate the average across neurons ± SEM. (f) Average z-score at 2 s time window before entering the cup area and 5 s after for activated (#1) and inhibited (#2) ensembles. p values less than 0.0001 are given four asterisks.

