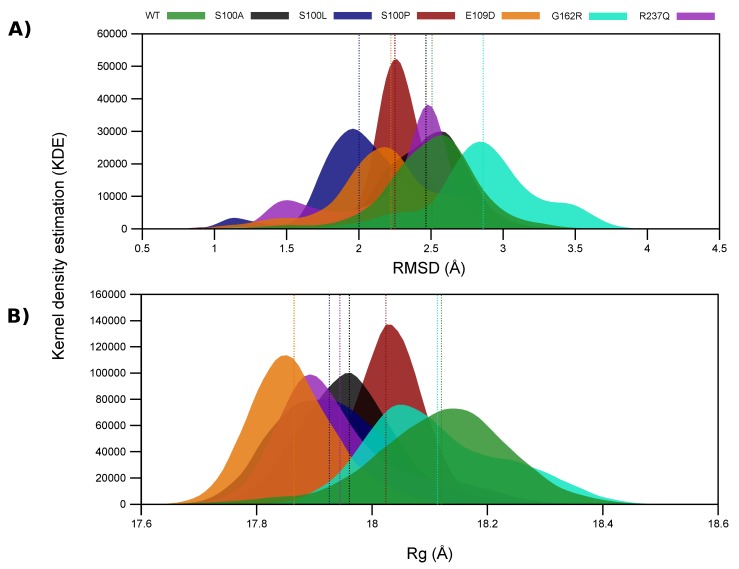
Figure 2.
-carbon RMSD and Rg distribution of the WT and variant proteins using the kernel density estimation. (A) RMSD; (B) Rg. The mean RMSD and Rg of the WT and variant proteins is presented as the dashed lines on each plot, and the colour of the dashed line is representative of the mean of the same coloured plot. The x-axis represents the sampled conformation RMSDs, and the y-axis peaks represent the RMSDs of the most sampled conformations.

