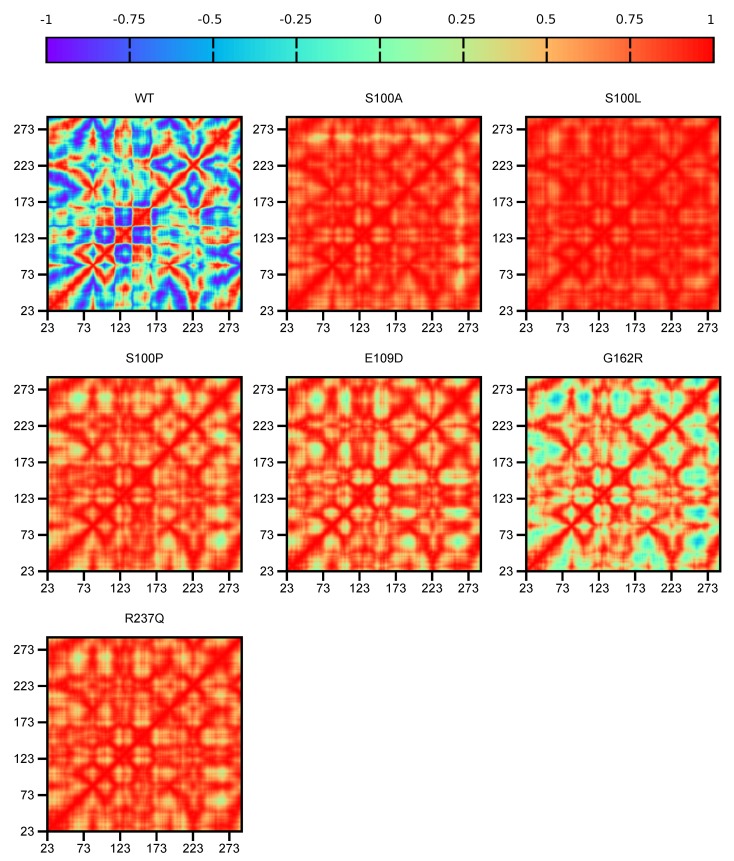
Figure 3.
CA-VIII DCC analysis showing protein residue correlation comparison between the WT and proteins. The x-axis and y-axis represent protein residues. A value of −1 indicates that residue movement is anti-correlated, 0 highlights no movement correlation and a value of 1 represents correlated residue movement.

