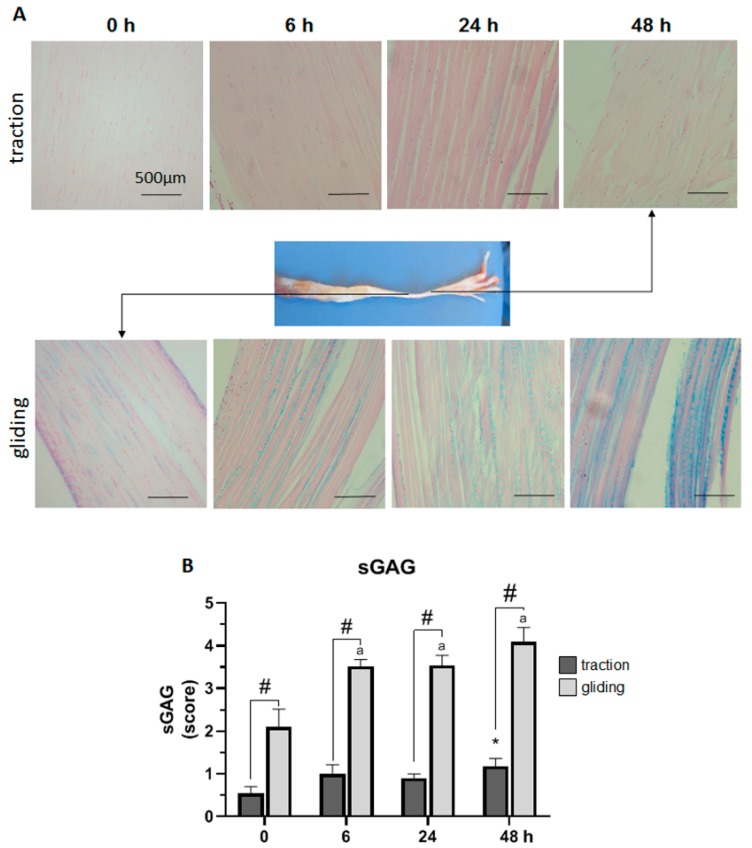
Figure 2.
Impact of uniaxial force on sulfated glycosaminoglycan (sGAG) expression in traction and gliding areas of tendon. The images (A) show representative sections of the traction (upper panel) and gliding (lower panel) tendons with Alcain blue staining after uniaxial treatment. The overview shows where these tendon types are located on the flexor digitorum longus muscle. Scoring of the staining revealed a steady increase in sGAG expression in both tendon tissue types. Note that sGAG expression in the traction region showed a significant increase after 48 h (B); but in the gliding region, a faster response was observable after 6 h, which was then followed by a less marked increase to the highest value after 48 h. In general, sGAG expression was significantly higher in the gliding than in the traction tendon. The p-values are given as p ≤ 0.05, p ≤ 0.01, and p ≤ 0.001. Asterisks indicating statistical differences in comparison to the 0 h control time point within the traction group, letters indicate statistical difference in comparison to the control time point within the gliding group, and hashtags indicate traction vs. gliding within the different time points.

