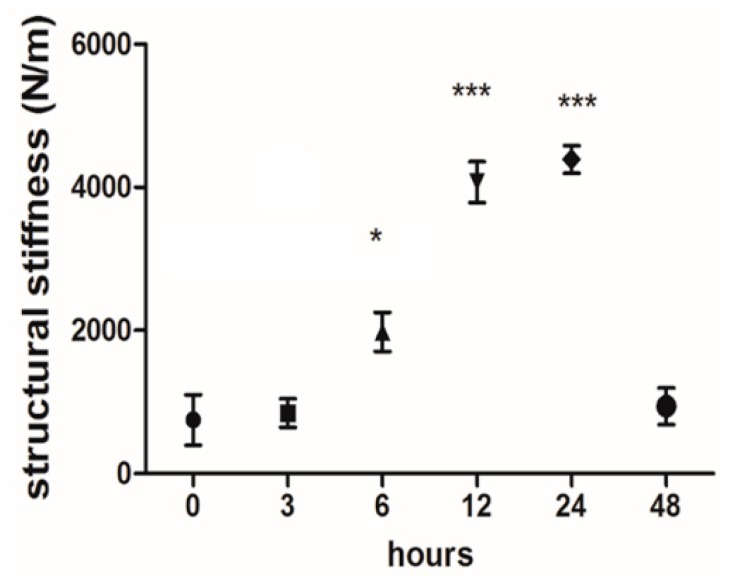
Figure 6.
Real-time structural stiffness monitoring during cultivation of the tendon. The average structural stiffness of the samples was plotted during the application of cyclic uniaxial mechanical stimulation. The graph shows the mean stiffness values (forces/elongation) measured at each time interval. The structural reaction force of the tendon tissues after 6 h was significantly higher than at the beginning (1981 ± 272 N/m vs. 755 ± 354 N/m). This trend continues to increase through 12 and 24 h (4.074 ± 285 N/m and 4.391 ± 192 N/m, respectively). The measured force and, therefore, the stiffness, declined in the latter half of the cultivation (941 ± 255 N/m at 48 h). *: p ≤ 0.05 and ***: p ≤ 0.001.

