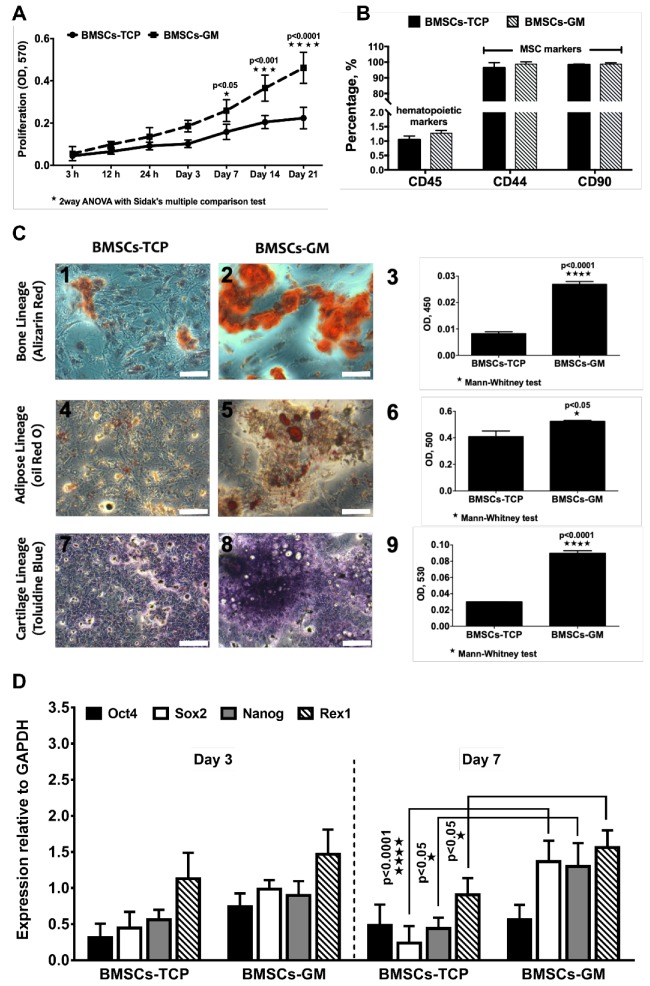
Figure 3.
Cell growth, characterization and differentiation of BMSCs on a tissue culture plate (TCP) (2D) and GM (3D). (A) The proliferation of BMSCs-TCP and BMSCs-GM studied using Presto Blue assay. (B) Immunophenotype of BMSCs-TCP and BMSCs-GM via flow cytometry analysis (C) Optical microscope images of Alizarin Red for osteogenic differentiation, Oil Red O staining for adipogenic differentiation and Toluidine Blue staining for chondrogenic differentiation. (D) Stemness marker genes Oct4, Sox2, Nanog, and Rex1 of BMSCs-TCP and BMSCs-GM after day 3 and day 7. The sample size (n) for each experiment was six (n = 6). (BMSCs-TCP/day 3; BMSCs-GM/day 3; BMSCs-TCP/day 7; BMSCs-GM/day 7). (C: 100× Magnification; scale bar: 100 µm).

