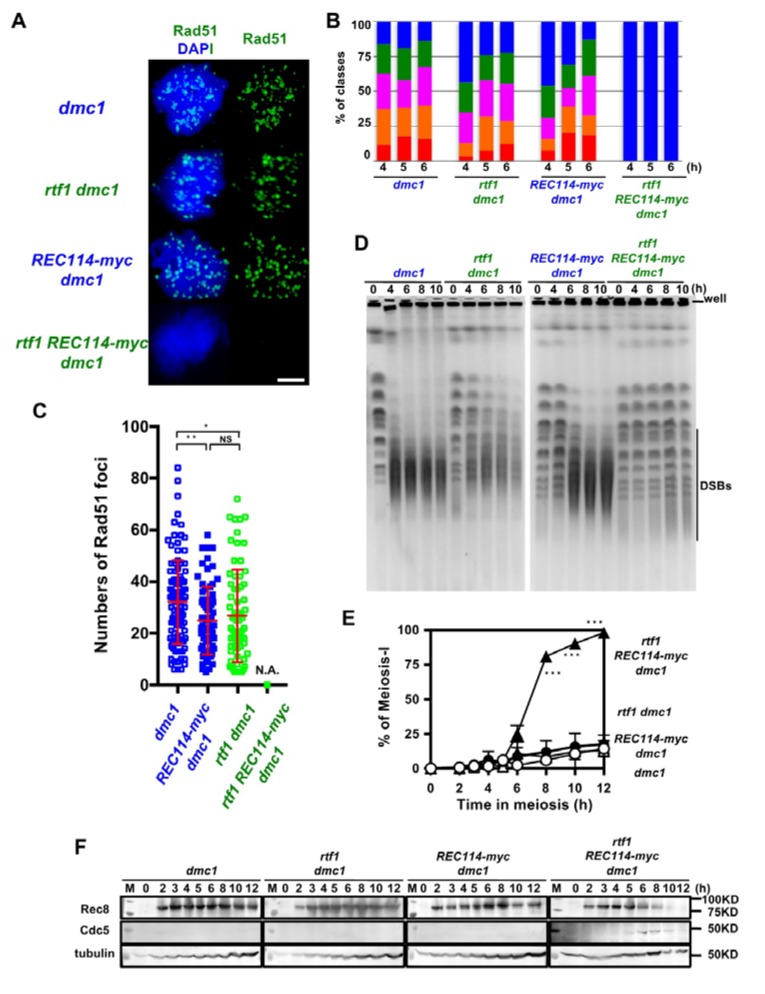
Figure 4.
The rtf1 shows a synthetic defect with REC114-myc in DSB formation in a dmc1 background. (A) Nuclear spreads from cells undergoing meiosis from various strains were stained with anti-Rad51 (green) and DAPI (blue). The representative images of Rad51 with DAPI from each strain are shown. dmc1, SGY854/855; rtf1 dmc1, SGY854/855; REC114-myc dmc1, ZYY1016; rtf1 REC114-myc dmc1, ZYY1029. Bar = 2 μm. (B) The number of Rad51 foci per a spread at 4, 5, and 6 h was counted and categorized into a spread with less than 5 (Rad51-negative, blue), 6–20 (green), 21–35 (purple), 36–50 (orange), and >50 (red) foci. The dmc1, rtf1 dmc1, and REC114-myc dmc1 mutant cells accumulated Rad51 foci during meiosis. On the other hand, the rtf1 REC114-myc dmc1 mutant showed little Rad51-foci formation. The graphs show percentage of each class of Rad51-foci number. The number is a sum from three independent time courses (n = 126; 42 × 3). Statistics for comparison between strains are shown in Table S2. (C) Distribution of Rad51 focus number in Rad51-foci positive nuclei (with more than 5 foci) in strains. The dmc1, rtf1 dmc1, and REC114-myc dmc1 mutant cells accumulated Rad51 foci during meiosis. On the other hand, the rtf1 REC114-myc dmc1 mutant showed little Rad51-foci formation. The p values and statistics for Rad51-foci number in foci-positive nuclei are shown in Table S2. * and ** indicate p < 0.05 and p < 0.01, respectively. NS shows Not Significant. Statistics for comparison between strains are shown in Table S2. (D) DSB repair on chromosomes were analyzed by the pulsed field gel electrophoresis (PFGE). Chromosomes were separated by PFGE and stained with EtBr. The same strains were used as in (A). The dmc1 as well as rtf1 dmc1 and REC114-myc dmc1 mutant cells showed normal chromosome ladders with intact chromosomes at 0 h (pre-meiosis) and loose bands of intact chromosomes with accumulation of smear bands with less than 500 kb after 4 h. The rtf1 REC114-myc dmc1 mutant showed almost intact chromosome bands from 4 to 10 h. (E) Meiotic cell cycle progression. Entry into meiosis I and II in the wild-type and various mutant cells were analyzed by DAPI staining. The number of DAPI bodies in a cell was counted. Graphs show the percent of cells that completed MI and/or MII at the indicated times. More than 200 cells were counted at each time point. Error bars show S.D. (three independent time courses). The dmc1, rtf1 dmc1, and REC114-myc dmc1 mutant cells showed an arrest during meiosis. On the other hand, the rtf1 REC114-myc dmc1 mutant carried our meiosis I division. Difference between rtf1 dmc1 and rtf1 REC114-myc dmc1 strains were compared. *** indicates p < 0.001. Statistics for comparison between strains are also shown in Table S2. (F) Cell lysates obtained from various dmc1 mutant cells at indicated times in meiosis were analyzed by Western blotting using anti-Rec8 (top), and anti-Cdc5 antibodies (middle). Rec8 was induced at 2 h after the induction of meiosis and accumulated in the dmc1, rtf1 dmc1, and REC114-myc dmc1 mutant cells. Cdc5 was not expressed in the dmc1, rtf1 dmc1, or REC114-myc dmc1 cells. On the other hand, in the rtf1 REC114-myc dmc1 mutant, Rec8 disappeared after 10 h and Cdc5 was expressed from 6 h. Tubulin was used as a control (bottom). “M” shows a marker.

