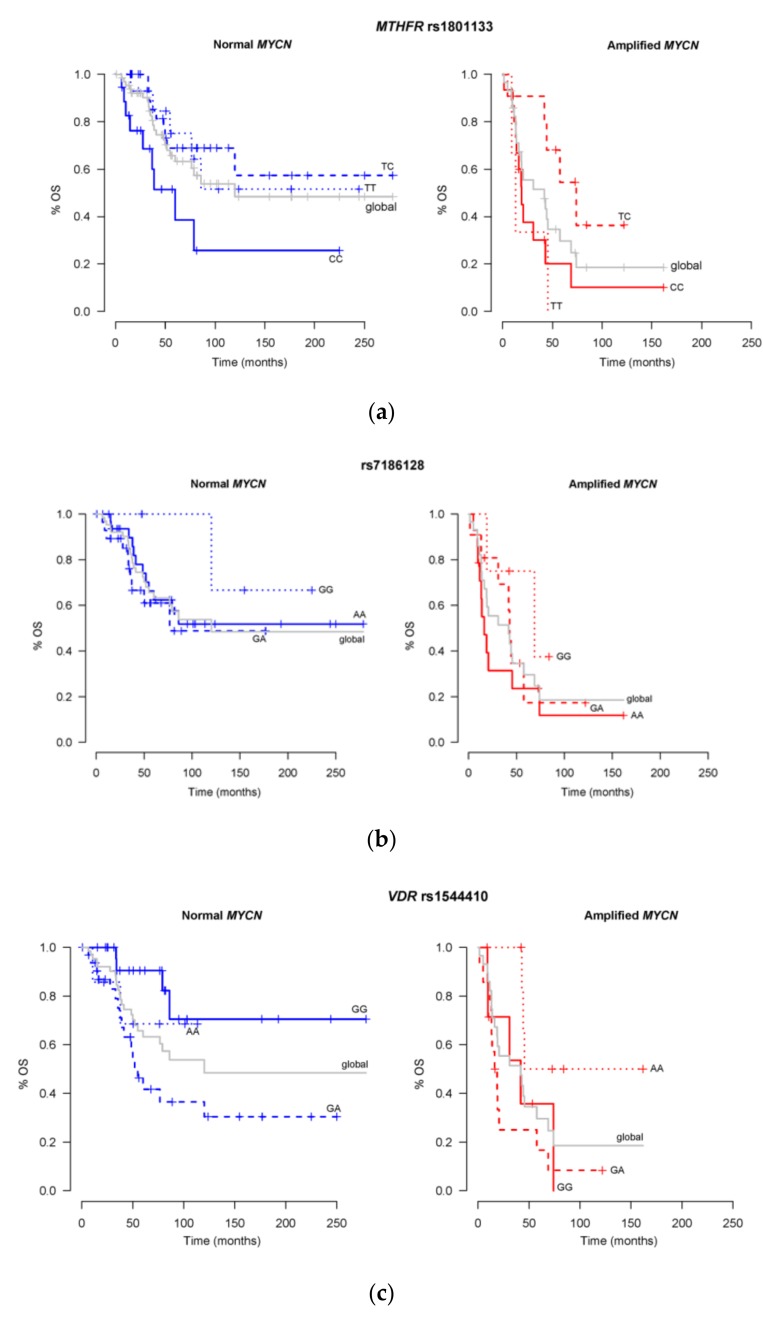
Figure 2.
Effect of the addition of the OS related SNPs, selected by Cox regression and Elastic Net, to the OS prognosis effect of MYCN status. The effect of MYCN status alone (Normal, n = 66, on the left panels or Amplified, n = 29, on the right panels) is represented by the grey line named “global”, while the same patients’ data distributed according to the SNP variants, are represented by the colored lines. (a) Shows the results according to SNP variants in rs1801133 at MTHFR gene, with TC genotype achieving p = 0.02 statistically significant difference comparing with the grey global lines. (b) shows the results according rs7186128 variants, with no statistical significance comparing with the global lines. (c) Shows the results according to SNP variants in rs1544410 at VDR gene, with GA genotype achieving p = 0.006 statistically significant difference comparing with the global grey lines.

