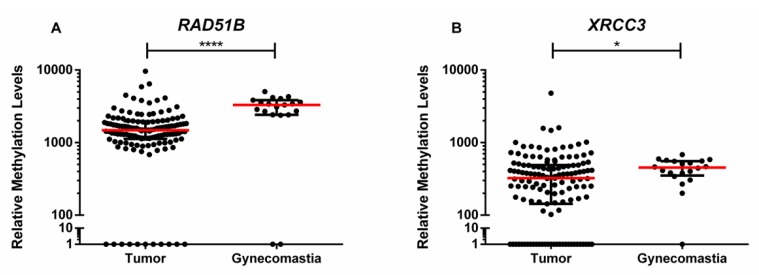
Figure 1.
Scatter plot of the distribution of (A) RAD51B and (B) XRCC3 relative methylation levels [(gene/β-Actin) × 1000] of tumor tissue samples (n = 128) and gynecomastia tissue samples (n = 19). Red horizontal line represents the median levels and the black lines the interquartile range. p value obtained by Mann–Whitney U test, * p < 0.05 and **** p < 0.0001.

