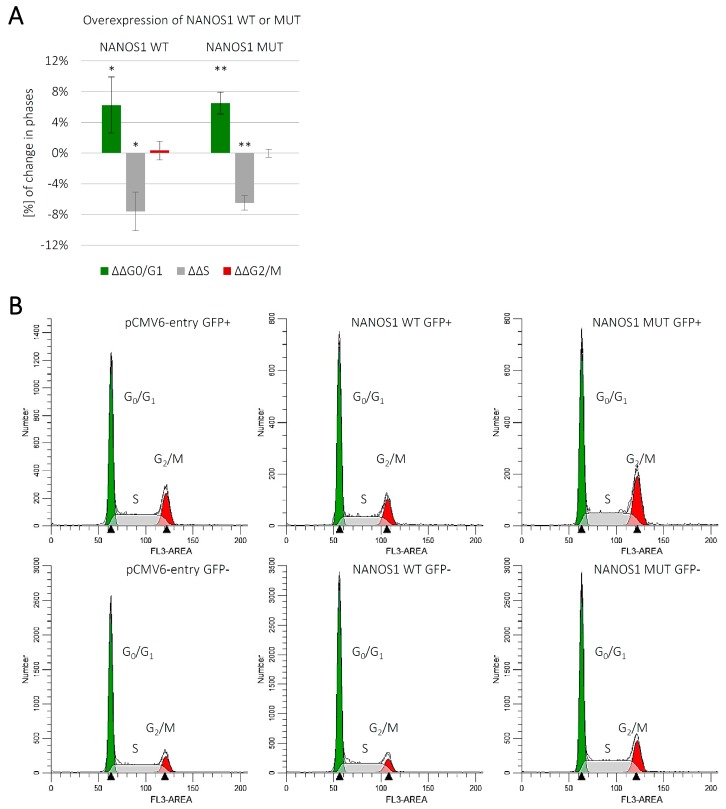
Figure 2.
Cell cycle analysis of propidium iodide-stained TCam-2 cells by flow cytometry. (A) The graph represents distribution at G0/G1, S, and G2/M cell cycle phases of unsynchronized TCam-2 cells overexpressing the wild-type (WT) NANOS1 or the mutated (MUT) NANOS1 p.[(Pro34Thr);(Ser83del)] compared to the empty pCMV6-entry control vector (baseline). Flow cytometry measurement of the distribution was performed 48 h after transfection with the construct encoding the wild-type, the mutated NANOS1 or the empty pCMV6-entry vector co-transfected with GFP-F. Percentages of cells in each cell cycle phase were calculated using ModFit LT 5.0 software. This experiment was repeated in four independent replicates. A p value < 0.05 was considered statistically significant and was marked by one asterisk (*), and a p value < 0.005 was marked by two asterisks (**). (B) Histogram representation of the TCam-2 cell distribution at G0/G1, S, and G2/M phases of the cell cycle in unsynchronized culture upon transfection with the construct encoding the wild-type (WT) or the mutated (MUT) NANOS1 or the empty pCMV6-entry vector co-transfected with GFP-F. Histograms were generated by ModFit LT 5.0 software and show one representative example from four independent experiments.

