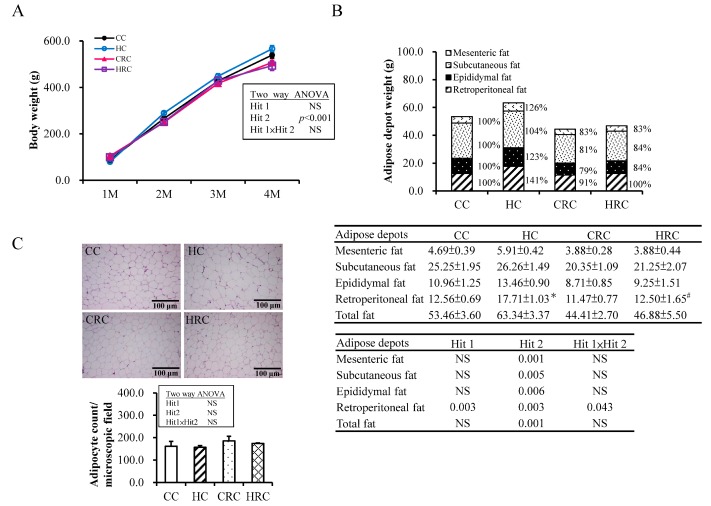
Figure 1.
Phenotypes of the offspring groups at four-month-old. (CC: maternal control diet + postnatal control diet; HC: maternal high-fat (HF) diet + postnatal control diet; CRC: maternal control diet + maternal resveratrol treatment + postnatal control diet; HRC: maternal HF diet + maternal resveratrol treatment + postnatal control diet); (A) Body weight change with prenatal HF diet exposure or/and resveratrol treatment. The results represent mean ± standard error. Two-way ANOVA analysis result for offspring at four-month-old was shown. (B) Weights of adipose depots change with prenatal HF diet exposure or/and resveratrol treatment. The results represent mean ± standard error (* p < 0.05 compared to CC group; # p < 0.05 compared to HC group). (C) Adipocyte sizes change with prenatal HF exposure or/and resveratrol treatment. The bar graph showing the adipocyte counts per microscopic field. (N= CC:14 HC:13 CRC:17 HRC:8).

