Figure 1.
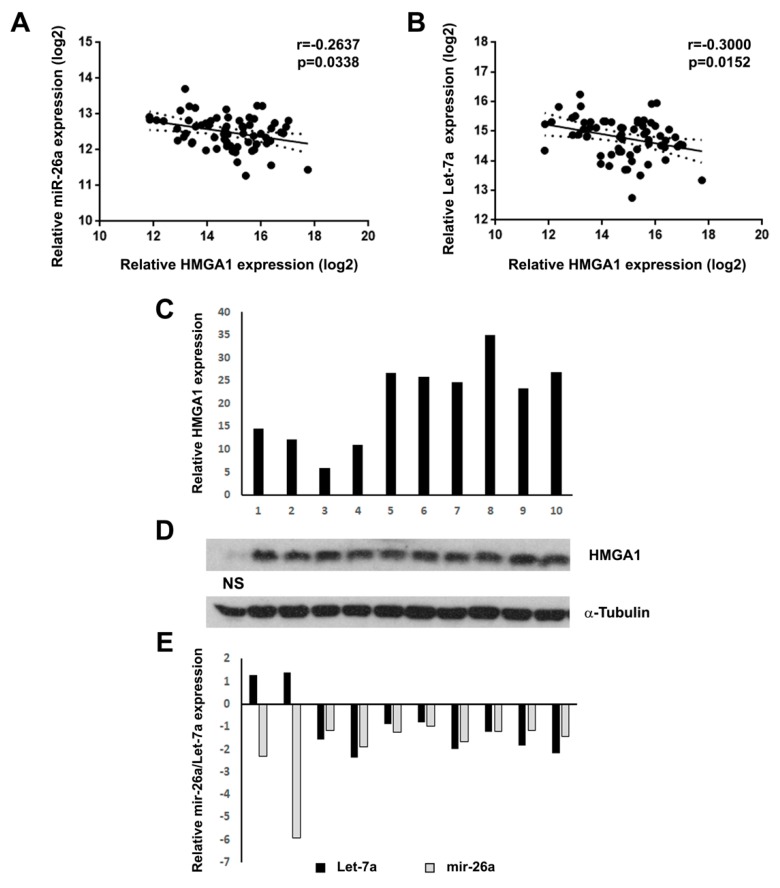
mir-26a and Let-7a are downregulated in seminoma and are negatively correlated with HMGA1. (A) Correlation scatter plot (Spearman’s Rank) analysis between mir-26a and HMGA1 expression levels in the TCGA cohort (n = 65) (r = −0.2637; p = 0.0338). (B) Correlation scatter plot (Spearman’s Rank) analysis between Let-7a and HMGA1 expression levels in the TCGA cohort (n = 65) (r = −0.3000; p = 0.0152). (C) qRT-PCR analysis of HMGA1 mRNA expression in 10 seminoma samples. The fold change indicates the relative change in expression levels between seminoma and normal testis tissues, assuming that the mean value of three normal testis samples is equal to 1. (D) western blot analysis of HMGA1 protein expression in same testis samples analyzed in C. The level of α-tubulin was used as loading control. NS: Normal sample. (E) miR-26a and Let-7a qRT-PCR analysis in the same seminoma samples of C.

