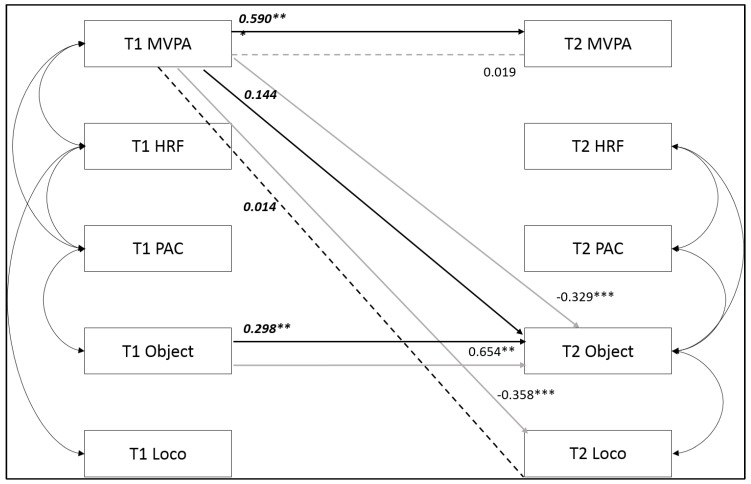
Figure 2.
Pathways between variables from 6th class (T1) to 1st year (T2) that were statistically significantly different between males and females. Only significantly different pathways are shown. All other pathways were not statistically different by sex. Note: * Standardised regression coefficients significant at p < 0.05; ** p < 0.01; *** p < 0.001. Grey line = female pathway; black line = male pathway. Dashed line = non-significant pathway. Regression coefficients shown in italics = male values.

